
QX VolumeProfile Pro
Indikator
Version 1.0, Jan 2026
Windows, Mac
5.0
Bewertungen: 1
Beschreibung
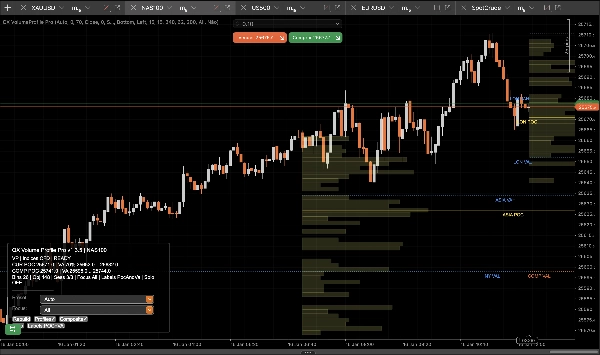
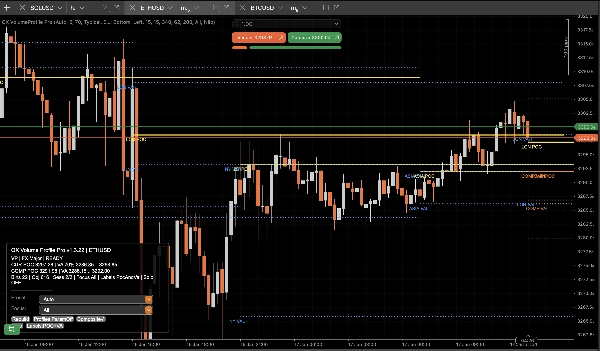
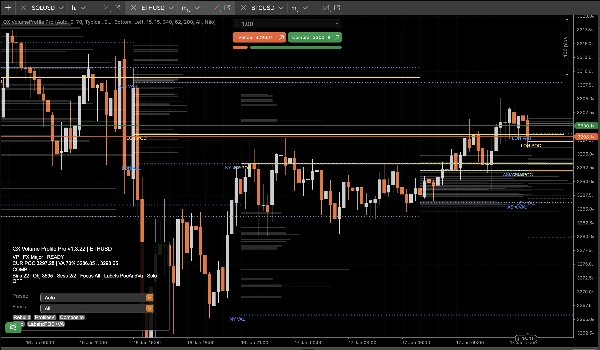
QX Volume Profile Pro ist ein Produktionsreifes Session Volume Profile entwickelt für reale Handelsbedingungen: schnell, stabil, deterministisch, und sauber am rechten Rand.
Hören Sie auf, aufgeblähte „Profil“-Tools zu verwenden, die verzögern, Ihr Chart überladen, die automatische Skalierung zerstören und Geisterobjekte hinterlassen.
Warum QX VP Pro anders ist?
Was die meisten Tools falsch machen, haben wir eliminiert:
- Keine Geisterobjekte. Profile/Labels EIN/AUS schalten ohne übrig gebliebenen Müll.
- Keine Chart-Verzerrung. Echtes Overlay-Verhalten, das die Preis-Autoskalierung nicht zerstört.
- Live-taugliche Leistung. Läuft bar-close für Stabilität und Geschwindigkeit, nicht Tick-Chaos.
- Objekthygiene + Limits. Verhindert unkontrolliertes Chart-Objekt-Spam, der die Leistung beeinträchtigt.
- Deterministischer Wiederaufbau. Neuladen, Wiederaufbau und Fokusänderungen bleiben konsistent und vorhersehbar.
Was Sie im Chart erhalten
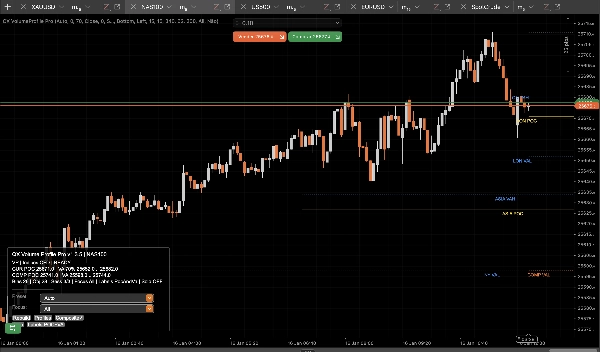
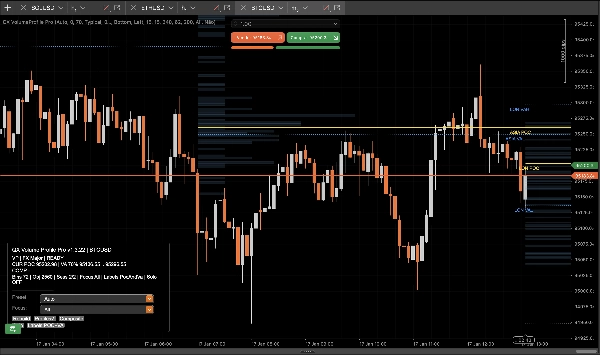
- Session-Profile (ASIA / LON / NY / C1 / C2) mit sauberen POC / VAH / VAL Levels.
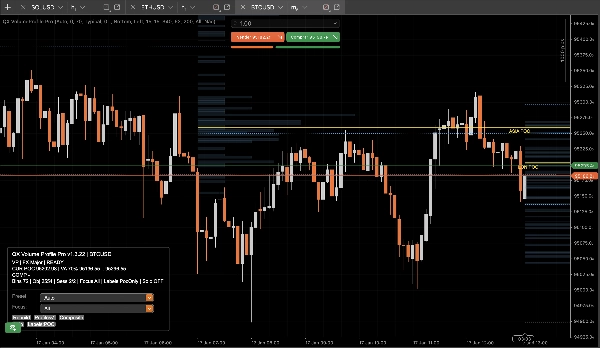
- Composite Profile (Multi-Session zusammengeführt) für dominante Wertzonen und „echte“ Marktakzeptanz.
- Schlüssel-Level (Gestern + Wöchentlich) für Kontext und Übereinstimmung ohne Überladung.
- Intelligente Labels die die Session identifizieren und Überlappungen für schnelles Lesen am rechten Rand reduzieren.
- Focus Session Filter um nur das zu isolieren, was gerade wichtig ist.
- Composite Solo Modus für eine chirurgische Ansicht: nur Composite + Schlüssel-Level.
Wie man es benutzt (Praktischer Handelsablauf)
1) Wählen Sie Ihren Betriebsmodus
- Session-Modus: Verwenden Sie Session POC/VAH/VAL als intraday Akzeptanz- und Ablehnungsebenen.
- Composite-Modus: Verwenden Sie Composite POC/VAH/VAL als höher vertrauenswürdige „Wert“-Anker über Sessions hinweg.
2) Einrichtung für Ihren Stil
- Scalper:
-
- Verwenden Sie XAU Scalper oder FX Major Voreinstellung
- Stellen Sie Labels = nur POC für maximale Klarheit ein
- Verwenden Sie Focus = Aktuell während der Ausführung
- Intraday / Swing:
-
- Verwenden Sie XAU Swing oder Indices CFD Voreinstellung
- Aktivieren Sie Composite
- Lassen Sie Gestern/Wöchentlich AN für Strukturabgleich
3) Interpretieren Sie die Levels (einfache Regeln)
- POC (Point of Control): Der Preis, der am meisten vom Volumen akzeptiert wird.
-
- Über POC: bullische Akzeptanz-Tendenz
- Unter POC: bärische Akzeptanz-Tendenz
- VAH / VAL (Value Area High/Low): „Fair-Value-Grenze.“
-
- Ausbruch + Halten außerhalb VA: Fortsetzung / Trendausweitung
- Ablehnung zurück innerhalb VA: Mittelwertumkehr / Fade-Setups
- Composite VA: Stärkere „makro-intraday“ Wertzone. Verwenden Sie sie als Magnet oder Grenze.
4) Ausführung Checkliste (schnell)
- Identifizieren Sie Ihre Schlüsselzone: Session VA oder Composite VA
- Achten Sie auf Preisreaktionen: Ablehnung oder Akzeptanz
- Verwenden Sie Schlüssel-Level (Gestern/Wöchentlich) als Übereinstimmung
- Verwenden Sie Focus um Rauschen zu entfernen und objektiv zu bleiben
- Verwenden Sie Composite Solo wenn Sie nur die Ansicht mit dem höchsten Signal wollen
Steuerungen (Was das Panel macht)
- Profile: Histogramme sofort anzeigen/verbergen (Levels bleiben sauber und konsistent).
- Composite: Zusammengeführte Profilebenen umschalten.
- Focus: Alle / Aktuell / ASIA / LON / NY / C1 / C2.
- Solo: Nur Composite + Schlüssel-Level.
Hinweise
- Nur Indikator. Es werden keine Trades ausgeführt.
- Entwickelt für Stabilität und Leistung in Live-Charts.
Zusammenfassung
KI-Zusammenfassung
QX VolumeProfile Pro is a session-based volume profile indicator designed for real trading conditions, offering fast, stable, and deterministic performance without chart clutter or lag. It provides clean volume profiles for multiple trading sessions (ASIA, LON, NY, C1, C2) with key levels including Point of Control (POC), Value Area High (VAH), and Value Area Low (VAL). The tool supports both session and composite modes, allowing traders to analyze intraday acceptance/rejection levels or multi-session value zones.
Key features include:
- No ghost objects or chart distortion, preserving autoscale integrity.
- Live-ready bar-close updates for stability and speed.
- Object management to prevent performance degradation.
- Smart labels that reduce overlap for clear right-edge reading.
- Focus session filtering to isolate relevant data.
- Composite Solo mode for a simplified view with composite profiles and key levels.
The indicator supports practical workflows for scalpers and intraday/swing traders with presets tailored for instruments like gold (XAU), forex majors, indices, and CFDs. Users can toggle profile visibility, composite levels, focus sessions, and solo mode via an integrated control panel.
QX VolumeProfile Pro is an indicator-only tool, designed to enhance chart analysis by highlighting volume-based market acceptance and rejection zones without executing trades.
Indikatorprofil
Kundenbewertungen
5.0
Bewertungen: 1
5 | 100 % | |
4 | 0 % | |
3 | 0 % | |
2 | 0 % | |
1 | 0 % |
Kundenbewertungen
January 27, 2026
Not perfect, but the workflow felt cleaner. It should not replace the chart.
Diskussion
Häufig gestellte Fragen (FAQ)
Signal
Indices
Commodities
GBPUSD
RSI
Bollinger
Fibonacci
Scalping
AI
XAUUSD
NAS100
MACD
BTCUSD
Forex
Breakout
EURUSD
NZDUSD
Prop
ZigZag
Supertrend
Fair Value Gap
SMC
Crypto
Grid
Stocks
ATR
USDJPY
VWAP
Über den cTrader Store verfügbare Produkte, einschließlich Handelsbots, Indikatoren und Plugins, werden von externen Entwicklern bereitgestellt und nur zu Informations- und technischen Zugriffszwecken verfügbar gemacht. cTrader Store ist kein Broker und erbringt keine Anlageberatung, persönlichen Empfehlungen oder eine Garantie für zukünftige Performance.


Preis
41.97M
Gehandeltes Volumen
208.53K
Pip-Gewinn
13
Verkäufe
361
Kostenlose Installationen