
Beschreibung
Time To Break Even Indicator v2
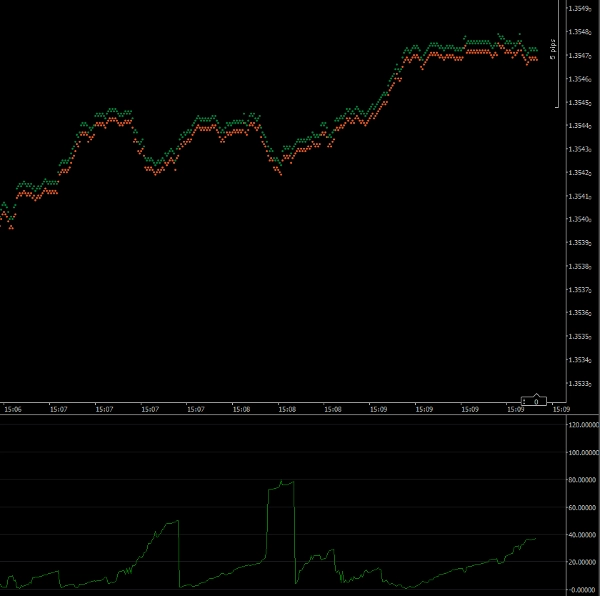
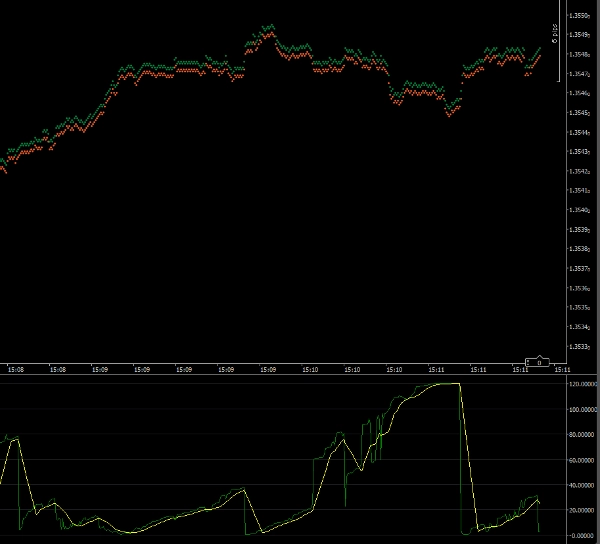
Dieser Indikator hilft Ihnen, den Einstieg Ihres Trades in den Markt zu timen. Die Darstellung zeigt Ihnen die voraussichtliche Anzahl der Sekunden, bis Ihr Trade den Break-even-Punkt erreicht. Bewegt sich der Markt schnell und in Ihre Richtung, zeigt der Indikator eine kleine Zahl an. Bewegt sich der Markt gegen Sie oder langsam, wird die Zahl größer sein.
Der Indikator berechnet die Anzahl der Pips, die Ihr Trade benötigt, um den Break-even-Punkt zu erreichen. Anschließend vergleicht er dies mit der aktuellen Geschwindigkeit, mit der sich der Preis bewegt.
Hinweis: Dieser Indikator sollte im 1-Tick-Zeitrahmen ausgeführt werden.
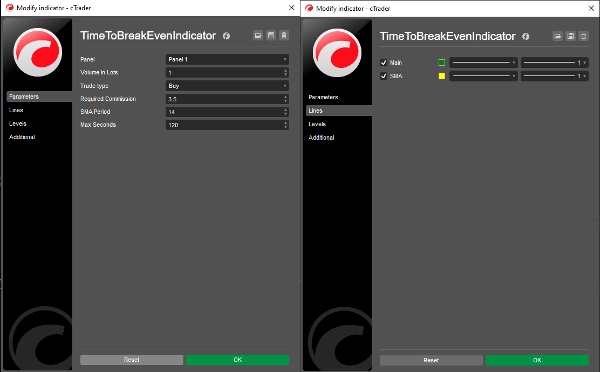
Parameter
Volumen in Lots: Das Volumen Ihres geplanten Trades
Trade-Typ: Ob Ihr Trade ein Kauf oder Verkauf sein soll
Erforderliche Kommission: Die Kommission, die Ihr Trade verursacht (diese können Sie dem Quick Trade Fenster entnehmen)
SMA-Periode: Die Periode der Simple Moving Average-Darstellung (Standard = 14)
Maximale Sekunden: Die maximale Anzahl an Sekunden, die aufgezeichnet wird (siehe unten)
Linien
Hauptlinie: Die Indikator-Darstellungslinie (Standard = grün)
SMA: Die Simple Moving Average-Darstellungslinie (Standard = gelb)
Maximale Sekunden
Wenn der Indikator sehr große Werte anzeigen darf, verhindert die Skala des Indikators, dass Sie Details sehen können, wenn die Zeit bis zum Break-even klein ist. Mit diesem Parameter können Sie die maximale Skala des Indikators festlegen. Standardmäßig ist er auf 120 (2 Minuten) eingestellt. Jede Ausgabe von 2 Minuten oder mehr wird also als 120 Sekunden dargestellt.
Dr. Andy Larkin
Copyright 2025, Alle Rechte vorbehalten
26. Mai 2025
Rechtliches
Die Ergebnisse dieses Indikators sollten vor der Verwendung im Live-Handel auf Genauigkeit überprüft werden.
Es wird keine Garantie für die Ergebnisse dieses Indikators gegeben oder impliziert.
Für Verluste, die durch die Nutzung dieses Indikators entstehen, wird keine Haftung übernommen.
Zusammenfassung
Kundenbewertungen
5 | 50 % | |
4 | 50 % | |
3 | 0 % | |
2 | 0 % | |
1 | 0 % |


