
ScalperSignalVisual
Indikator
191 downloads
Version 1.0, Aug 2025
Windows, Mac
Beschreibung
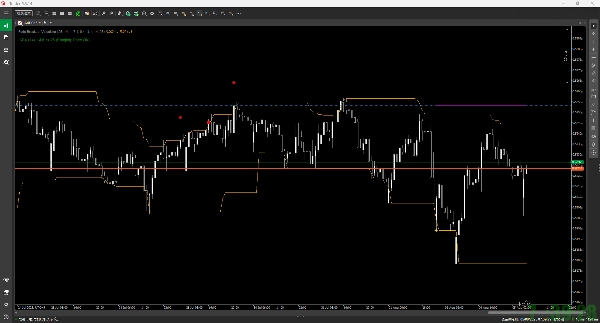
Dieser Indikator ist ein Werkzeug, um die Handelslogik einer konträren Strategie namens „Fade Breakout“ in Ihrem Chart zu visualisieren. Er führt keine tatsächlichen Trades aus, sondern zeigt, wie eine Position vom Einstieg bis zum Ausstieg verwaltet würde, wenn ein Signal auftritt.
Hauptmerkmale
- Einstiegssignale:
-
- Es nutzt den Donchian Channel.
- Kaufsignal (konträr): Wenn der Preis unter die untere Donchian-Channel-Linie fällt, wird ein Kaufsignal (blauer Pfeil nach oben ↑) angezeigt.
- Verkaufssignal (konträr): Wenn der Preis über die obere Donchian-Channel-Linie ausbricht, wird ein Verkaufssignal (roter Pfeil nach unten ↓) angezeigt.
- Risikomanagement:
-
- Beim Einstieg werden ein initialer Stop-Loss (rote gestrichelte Linie) und ein erster Take-Profit (grüne gestrichelte Linie) basierend auf dem ATR (Average True Range) gesetzt.
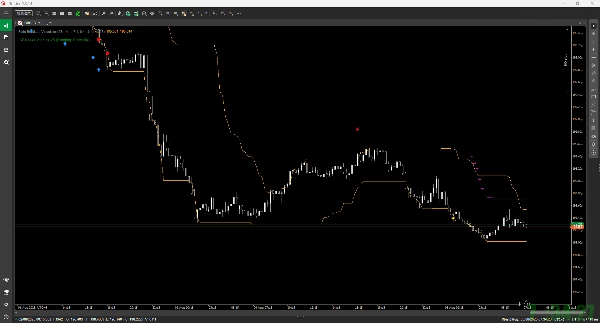
- Wenn der erste Take-Profit (TP1) erreicht wird, erscheint ein goldener Stern (★) und der Stop-Loss wird auf den Einstiegspreis (Break-even) verschoben.
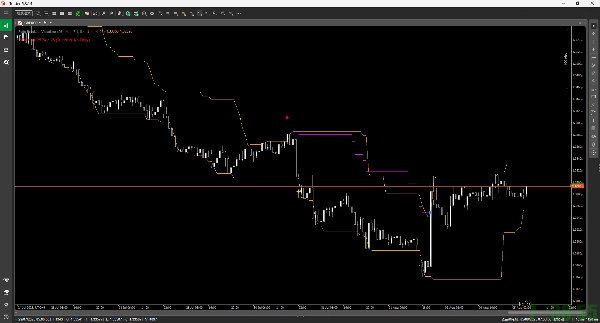
- Danach aktiviert sich ein ATR-basierter Trailing Stop, um Gewinne zu sichern, indem er dem Preis folgt. Der Pfad des Trailing Stops wird als magentafarbene Linie dargestellt.
- Trade-Ausgänge:
-
- Stop-Loss: Wenn der Preis das Stop-Loss-Niveau erreicht, wird dies mit einem roten Quadrat (■) markiert.
- Trailing-Stop-Ausgang: Wenn der Preis den Trailing Stop erreicht, wird dies mit einem blauen Quadrat (■) markiert.
- ADX-Filter:
-
- Sie können optional den ADX-Filter aktivieren.
- Wenn der ADX höher als ein bestimmter Wert ist (was auf einen starken Trend hinweist), werden neue Einstiegssignale deaktiviert. Der aktuelle Status (Entry OK / No Entry) wird im Text oben links im Chart angezeigt.
Zusammenfassung
Indikatorprofil
Kundenbewertungen
0.0
Bewertungen: 0
Kundenbewertungen
Bisher gibt es keine Bewertungen für dieses Produkt. Haben Sie es schon ausprobiert? Dann können Sie die erste Person sein, die andere darüber informiert!
Diskussion
Häufig gestellte Fragen (FAQ)
Über den cTrader Store verfügbare Produkte, einschließlich Handelsbots, Indikatoren und Plugins, werden von externen Entwicklern bereitgestellt und nur zu Informations- und technischen Zugriffszwecken verfügbar gemacht. cTrader Store ist kein Broker und erbringt keine Anlageberatung, persönlichen Empfehlungen oder eine Garantie für zukünftige Performance.
Mehr von diesem Autor


Preis
1
Verkäufe
1.34K
Kostenlose Installationen