
QX MatrixHybrid
Indikator
Version 1.0, Feb 2026
Windows, Mac
4.6
Bewertungen: 3
Beschreibung
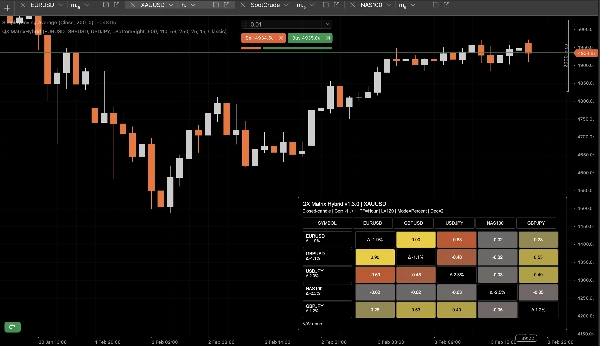
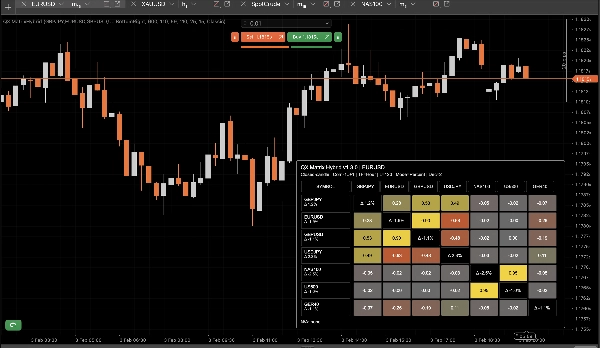
QX Matrix Hybrid ist ein visueller Indikator, der eine Multi-Asset-Korrelationsmatrix als sauberes Heatmap-Panel anzeigt. Er hilft Ihnen, sofort zu erkennen, welche Instrumente sich gemeinsam bewegen, welche sich entgegengesetzt bewegen und wo Sie möglicherweise unbeabsichtigt eine doppelte Marktexposition haben.
Hauptmerkmale
- Korrelationsmatrix (-1 bis +1) unter Verwendung der Pearson-Korrelation zwischen Symbolen.
- Renditemodus:
-
- Prozentuale Renditen
- Logarithmische Renditen
- Stärke (Δ%) pro Symbol: zeigt die Performance jedes Symbols über das Betrachtungsfenster (in Zeilenbeschriftungen und optional auf der Diagonale).
- Automatischer Textkontrast: die Textfarbe passt sich der Hintergrundhelligkeit zur besseren Lesbarkeit an.
- Themen + benutzerdefinierte Palette: mehrere Voreinstellungen plus vollständige Steuerung des benutzerdefinierten Farbwählers.
- Flexibles Panel-Layout: Eck-Docking, Breite, Zellgröße, Ränder, Zeilenhöhensteuerung.
- Intelligente Fußzeile: listet fehlende/nicht verfügbare Symbole mit konfigurierbarer Kürzung auf.
Leistungs- & Aktualisierungslogik
Entwickelt, um auch bei mehreren Symbolen reaktionsschnell zu bleiben:
- Pro-Symbol-Caching von Symbol- und Bars-Objekten, um wiederholte API-Aufrufe zu vermeiden.
- Automatische Cache-Invalidierung wenn Symbols CSV oder TimeFrame geändert wird.
- Nur geschlossene Kerzen Modus zur Minimierung der CPU-Belastung (Aktualisierungen bei neuen geschlossenen Bars).
- Optionale Update-Drosselung (ms) für den Live-Modus.
Anwendung
- +1.00: starke positive Gleichbewegung (hohe Redundanz).
- 0.00: geringe Beziehung (potenzielle Diversifikation).
- -1.00: starke inverse Beziehung (mögliche Absicherung).
Verwenden Sie die Matrix, um korrelierte Überschneidungen zu reduzieren, Absicherungspaare zu finden und Markt-“Cluster” über FX, Indizes, Metalle, Krypto usw. zu verstehen.
Parameter (übersicht)
- Symbols CSV, TimeFrame, Lookback
- Renditemodus (Prozent/Log), Dezimalstellen, Automatische Dezimalstellen bei Log
- Nur geschlossene Kerzen, Update-Drosselung
- Stärke anzeigen (Δ%), Fußzeile anzeigen, Max. fehlende Symbole in Fußzeile
- Panel-Layout (Ecke, Breite, Zellgrößen, Rand)
- Farben / Thema (einschließlich benutzerdefinierter Palette)
Hinweise
- Nur Visualisierung. Es werden keine Aufträge platziert.
- Symbole können N/A anzeigen, wenn sie bei Ihrem Broker/Server nicht verfügbar sind oder wenn nicht genügend Historie für den ausgewählten Zeitrahmen/Lookback vorhanden ist.
Zusammenfassung
KI-Zusammenfassung
QX MatrixHybrid is a real-time visual indicator that presents a multi-asset correlation matrix as a heatmap panel. It displays Pearson correlation coefficients ranging from -1 to +1 between up to 12 selected symbols, helping users identify strong positive correlations, inverse relationships, and low correlations for diversification or hedging purposes. The indicator supports multiple return modes, including percent and log returns, and tracks each symbol’s performance over a configurable lookback period, showing strength as percentage change.
The interface offers full customization with multiple color themes and a custom palette, adjustable panel layout options (such as docking, cell size, and margins), and automatic text contrast for readability. It includes a smart footer that lists missing or unavailable symbols with configurable truncation.
Performance optimizations include per-symbol caching to reduce API calls, automatic cache invalidation on symbol or timeframe changes, and a "Closed Candle Only" mode to minimize CPU load by updating only on new closed bars. An optional update throttle controls live update frequency.
QX MatrixHybrid is designed for use across various markets including forex, indices, commodities, metals, and cryptocurrencies. It is a visualization tool only and does not place orders. Symbols may show as unavailable if data is insufficient or missing.
Indikatorprofil
Kundenbewertungen
4.6
Bewertungen: 3
5 | 67 % | |
4 | 33 % | |
3 | 0 % | |
2 | 0 % | |
1 | 0 % |
Kundenbewertungen
February 12, 2026
The part that matters is bad ideas get easier to avoid, and 20 signals is a fair first sample.
February 9, 2026
Two sessions say more than one clean chart, and weak ideas are easier to skip.
February 5, 2026
Ngl, weak ideas are easier to skip and that is enough to keep testing it. Price action still has to agree.
Diskussion
Häufig gestellte Fragen (FAQ)
Signal
Indices
Commodities
GBPUSD
RSI
Bollinger
Fibonacci
Scalping
AI
XAUUSD
NAS100
MACD
BTCUSD
Forex
Breakout
EURUSD
NZDUSD
Martingale
Prop
ZigZag
Supertrend
Fair Value Gap
SMC
Crypto
Grid
Stocks
ATR
USDJPY
VWAP
Über den cTrader Store verfügbare Produkte, einschließlich Handelsbots, Indikatoren und Plugins, werden von externen Entwicklern bereitgestellt und nur zu Informations- und technischen Zugriffszwecken verfügbar gemacht. cTrader Store ist kein Broker und erbringt keine Anlageberatung, persönlichen Empfehlungen oder eine Garantie für zukünftige Performance.


![„[Stellar Strategies] Market Session Ultimate“-Logo](https://cdn.ctrader.com/image/webp/61ffd537-0125-4246-9e72-42eca1791d64_28232)


![„[Hamster-Coder] Pivot Points MTF“-Logo](https://cdn.ctrader.com/image/webp/4c143e5a-309c-40e3-a578-f04d1e133ffa_31159)


Preis
41.97M
Gehandeltes Volumen
208.53K
Pip-Gewinn
13
Verkäufe
353
Kostenlose Installationen