
Beschreibung
QX RiskShield ist ein On-Chart-Risikorechner, der Ihre Stop-Distanz in exakte Positionsgröße (Einheiten und Lots) umwandelt, plus SL/TP-Preisniveaus basierend auf Ihren R:R-Zielen. Es ist für schnelle Entscheidungen mit minimaler Chart-Unordnung konzipiert.
Dies ist ein nur Indikator. Es platziert keine Orders.
Was Sie sehen:
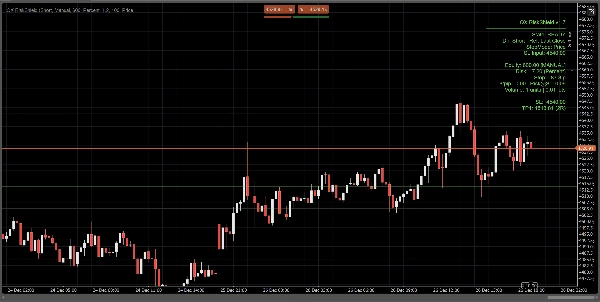
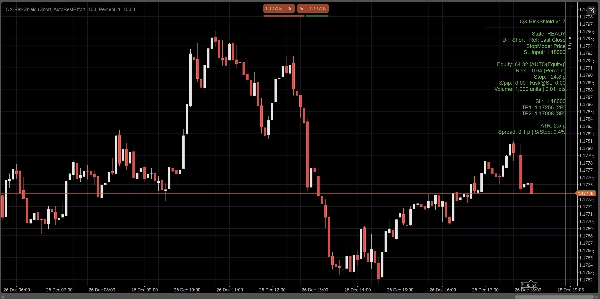
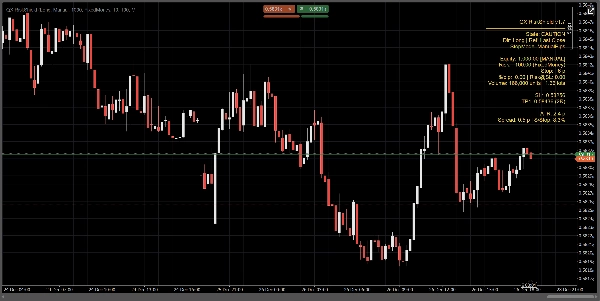
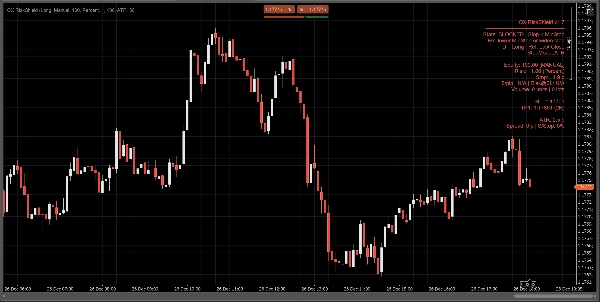
Ein kompaktes Panel zeigt auf einen Blick:
- Status: BEREIT / VORSICHT / GESPERRT
- Eigenkapitalquelle: Manuell oder Automatisch (Bestmöglich, sicherer Fallback)
- Risiko-Betrag: % des Eigenkapitals oder festes Geldrisiko
- Stop-Distanz: in Pips
- Positionsgröße: Einheiten + Lots (normalisiert auf Broker-Beschränkungen)
- $/pip und Risiko@SL (geschätztes Risiko am Stop)
- SL / TP1 / TP2 Preisniveaus (basierend auf Ihren RR-Zielen)
- Optionale Entry / SL / TP Linien im Chart zur visuellen Referenz
Alle Berechnungen basieren auf dem Letzten Schlusskurs (stabil, kein Intrabar-Flackern).
Stop-Modi:
Wählen Sie, wie Ihr Stop definiert wird:
1) Manuelle Pips
Legen Sie eine feste Stop-Distanz in Pips fest.
2) ATR Stop
Stop-Distanz = ATR(Pips) × ATR k.
Nützlich für volatilitätsadaptive Größenanpassung über Symbole hinweg.
3) Preis-Stop
Legen Sie den genauen SL-Preis fest (am besten für diskretionäres Trading).
RiskShield wandelt diese Preisdistanz in Pips um und passt die Positionsgröße entsprechend an.
Status-Logik (keine Verwirrung):
RiskShield verwendet klare Zustände, damit Benutzer sofort verstehen, was passiert:
BEREIT
Eingaben sind gültig. Positionsgrößenbestimmung ist verfügbar.
VORSICHT
Die Größenbestimmung ist gültig, aber RiskShield hat einen engen Stop im Vergleich zum ATR erkannt.
Dies ist eine Warnung, kein Block.
GESPERRT
Die Größenbestimmung ist absichtlich deaktiviert, wenn Regeln unsicher oder ungültig sind, wie zum Beispiel:
- Stop unterhalb des minimalen Stop-Schwellenwerts
- SL-Preis auf der falschen Seite des Referenzpreises
- Spread zu hoch im Verhältnis zum Stop (Spread/Stop %)
- Volumen wäre unter dem Broker-Minimum
- Symbol-Pip/Lot-Daten nicht verfügbar
Ein kurzer „Fix“-Hinweis kann angezeigt werden (optional), um Eingaben schnell zu korrigieren.
Wie Trader QX RiskShield verwenden (einfacher Workflow)
- Hängen Sie QX RiskShield an Ihren Chart an.
- Wählen Sie Handelsrichtung (Long oder Short).
- Wählen Sie Ihren Risiko-Typ:
-
- Prozent des Eigenkapitals, oder
- Festes Geldrisiko pro Trade
- Wählen Sie Stop-Modus:
-
- Manuelle Pips, ATR oder SL-Preis
- Lesen Sie die Ausgabe:
-
- Verwenden Sie Einheiten/Lots für Ihre Ordergröße
- Verwenden Sie SL/TP-Niveaus als Ihre Referenzpreise
- Wenn das Panel VORSICHT anzeigt, erwägen Sie, den Stop zu erweitern oder den ATR-Modus zu verwenden.
- Wenn das Panel GESPERRT anzeigt, passen Sie die Eingaben an, bis BEREIT angezeigt wird.
UI-Optionen (für saubere Charts entwickelt):
- Panel-Modus: Einfach oder Pro
- Panel-Dichte: Normal oder Kompakt (für minimalen Text)
- Vorgeschlagene Fix anzeigen: Ein/Aus
- Linien anzeigen: Ein/Aus
- Entry-Linie anzeigen: Ein/Aus
- Panel-Ausrichtungssteuerung und Update-Drosselung für Leistung
Leistung und Stabilität:
- Verwendet Letzten Schlusskurs für Berechnungen. Kein Repainting-Verhalten.
- Update-Drosselung zur Reduzierung der CPU-Auslastung bei stark frequentierten Arbeitsbereichen.
- Defensive Handhabung für Symboldaten, Broker-Beschränkungen und fehlende Kontofelder.
Wichtige Hinweise:
- QX RiskShield ist ein Entscheidungsunterstützungstool, keine Finanzberatung.
- Ergebnisse hängen von den Spezifikationen Ihres Broker-Symbols ab (Pip-Wert, Lot-Größe, Mindestvolumen usw.).
- Automatisches Eigenkapital ist bestmöglich. Wenn die Plattform den Zugriff einschränkt, fällt RiskShield sicher auf manuelles Eigenkapital zurück.
Ideal für:
- FX-Majors und Index-Trader
- Prop-Firm-Risikoregeln
- Scalper und Daytrader, die schnelle Größenanpassung mit strengen Sicherheitsprüfungen wünschen
- Trader, die preisbasierte SL bevorzugen, aber dennoch automatisierte Größenanpassung wünschen
Handeln Sie mit Kontrolle. Größen Sie mit Präzision.
Zusammenfassung
Kundenbewertungen
5 | 0 % | |
4 | 100 % | |
3 | 0 % | |
2 | 0 % | |
1 | 0 % |


