
E7 BlackScholes Model
مؤشر
254 التنزيلات
الإصدار 1.0، Feb 2025
Windows, Mac
5.0
التقييمات: 1
الوصف
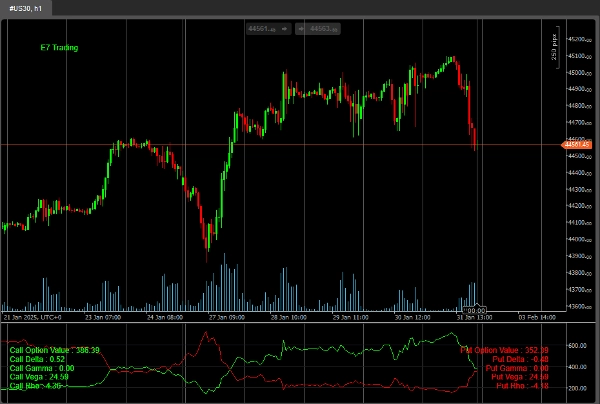
هذا مثال بسيط جدًا لاستخدام حزمة ‘Math.Numerics’ داخل cTrader لحساب تسعير الخيارات باستخدام نموذج بلاك-شولز.
الإصدار المستقبلي سيشمل تطبيقات أكثر تطورًا.
يجب استخدام هذا فقط للمؤشرات في الوقت الحالي، شكرًا.
صيد موفق!
الملخص
ملخص الذكاء الاصطناعي
E7 BlackScholes Model is an indicator designed for use within the cTrader platform that calculates option pricing based on the Black-Scholes model. It utilizes the Math.Numerics package to perform these calculations. Currently, the tool is intended primarily for indices such as NASDAQ, S&P 500, DAX, and Dow. The product offers a straightforward implementation of the Black-Scholes formula, with plans for more advanced versions in the future. This indicator assists traders in evaluating option prices on index markets by providing mathematical option valuation directly integrated into their trading environment.
ملف تعريف المؤشر
تقييمات العملاء
5.0
التقييمات: 1
5 | 100 % | |
4 | 0 % | |
3 | 0 % | |
2 | 0 % | |
1 | 0 % |
تقييمات العملاء
August 18, 2025
Pros: Calculates Black–Scholes theoretical option price and Greeks (Delta, Gamma, Theta, Vega) in real‑time. Lightweight and intuitive interface. Great for risk management and option analysis. Cons: No alerts or tooltips. Lacks template saving and real‑price comparison. Assumes constant volatility
مناقشة
الأسئلة الشائعة
Indices
يتم توفير المنتجات المتاحة من خلال cTrader Store، بما في ذلك روبوتات التداول والمؤشرات والإضافات، من قبل مطوري الطرف الثالث وإتاحتها لأغراض الوصول المعلوماتي والفني فقط. cTrader Store ليس وسيطًا ولا يقدم نصائح استثمارية أو توصيات شخصية أو أي ضمان للأداء المستقبلي.
المزيد من هذا المؤلف


السعر
منذ 18/12/2024
2
المبيعات
4.26K
التثبيتات المجانية