الوصف
تقديم مؤشر المتوسط المتحرك المحسن، المصمم لتوفير تخصيص ومرونة أفضل في تحليلك التداولي.
يدعم هذا الإصدار المحسن أيضًا المتوسطات المتحركة للإطارات الزمنية الأعلى إلى أُطُر الوقت الدقيقة و Heikin Ashi. فترات Renko و Range غير مدعومة بعد.
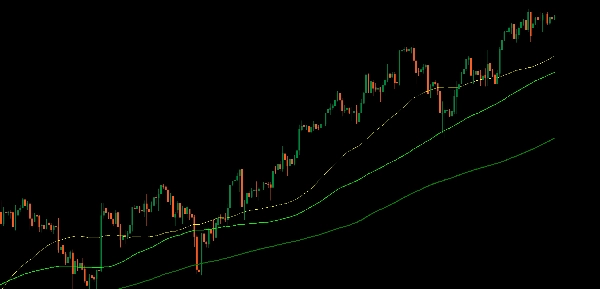
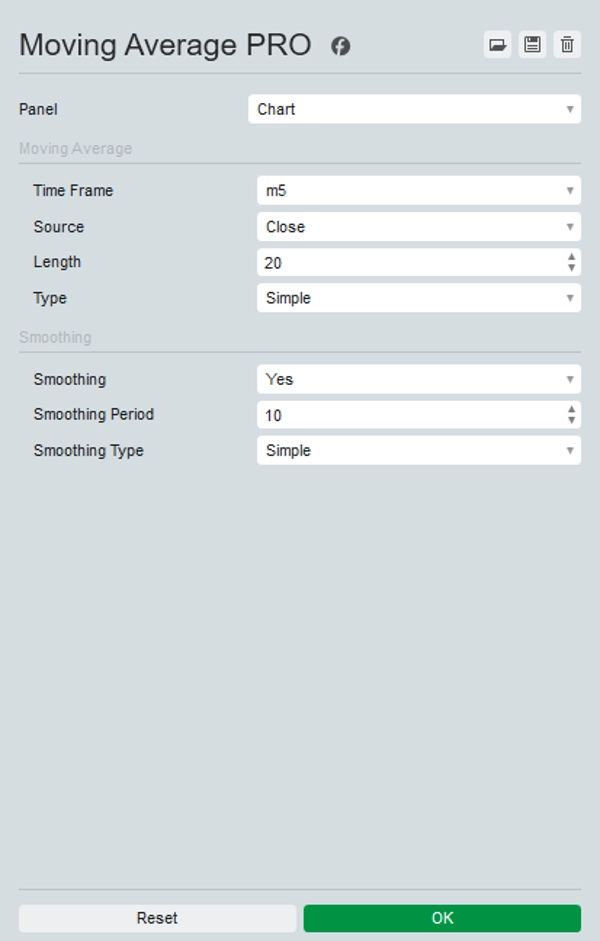
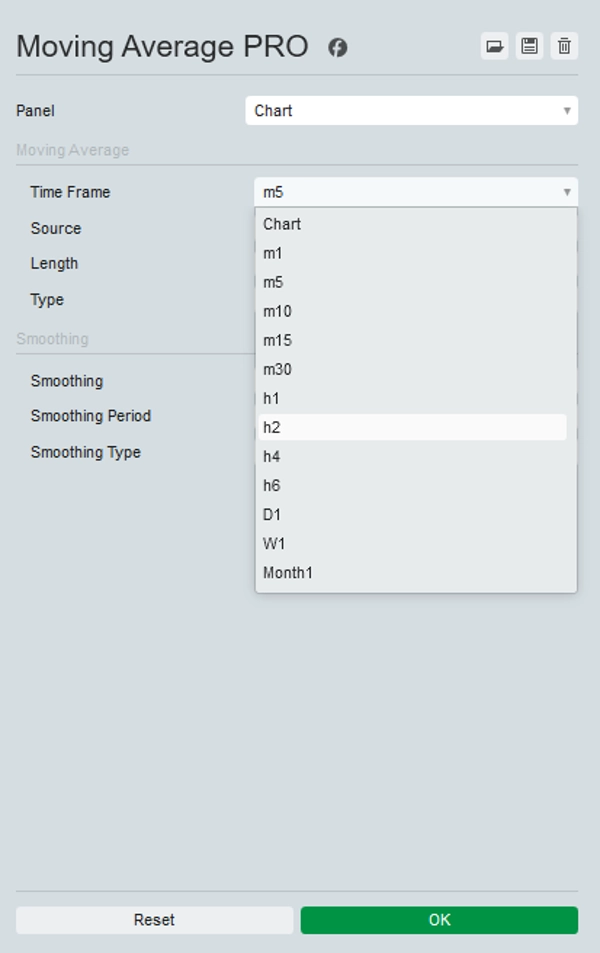
يتيح لك هذا المؤشر اختيار أي إطار زمني مما يمكنك من عرض، على سبيل المثال، المتوسط المتحرك 200 اليومي على أي إطار زمني آخر.
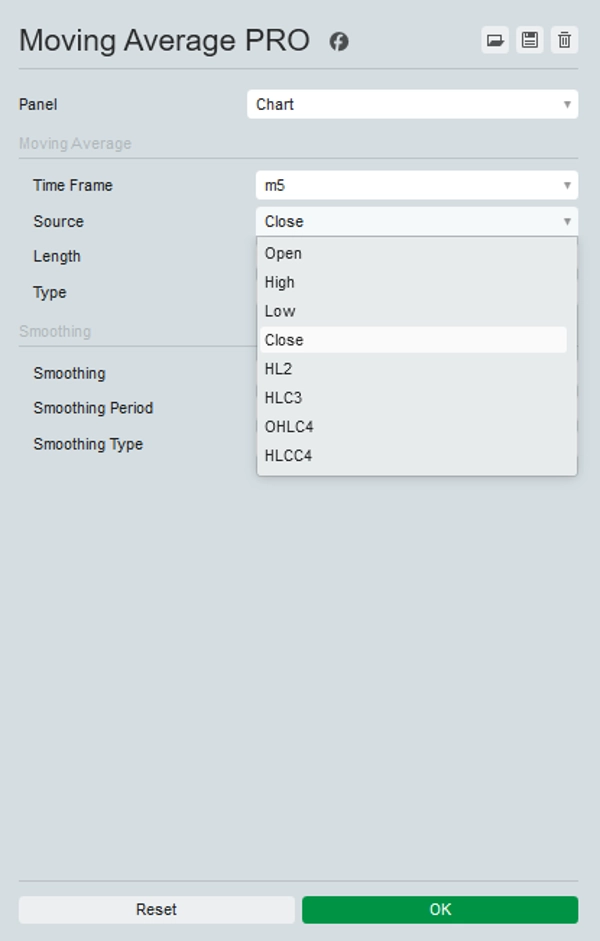
بالإضافة إلى ذلك، يقدم مجموعة من مصادر الأسعار للاختيار من بينها، بما في ذلك الافتتاح، الأعلى، الأدنى، الإغلاق، HL2، HLC3، OHLC4، و HLCC4، تمامًا كما في TradingView وخيارات تنعيم اختيارية لمعالجة مشاكل العينات في الأُطُر الزمنية الأقل.
من خلال توفير هذه الخيارات، يمكنك تخصيص المتوسط المتحرك ليناسب استراتيجيتك التداولية المحددة والحصول على رؤى أكثر دقة حول اتجاهات السوق.
قم بترقية أدوات التداول الخاصة بك مع مؤشر المتوسط المتحرك المحسن لتحليل واتخاذ قرارات أفضل.
الملخص
تقييمات العملاء
5 | 100 % | |
4 | 0 % | |
3 | 0 % | |
2 | 0 % | |
1 | 0 % |