
الوصف
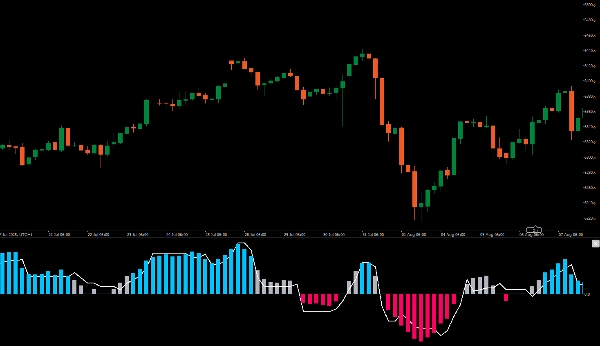
تقديم مؤشر QQE المتقدم (التقدير الكمي النوعي)، أداة قوية تجمع بين مؤشرين QQE لتعزيز رؤى التداول.
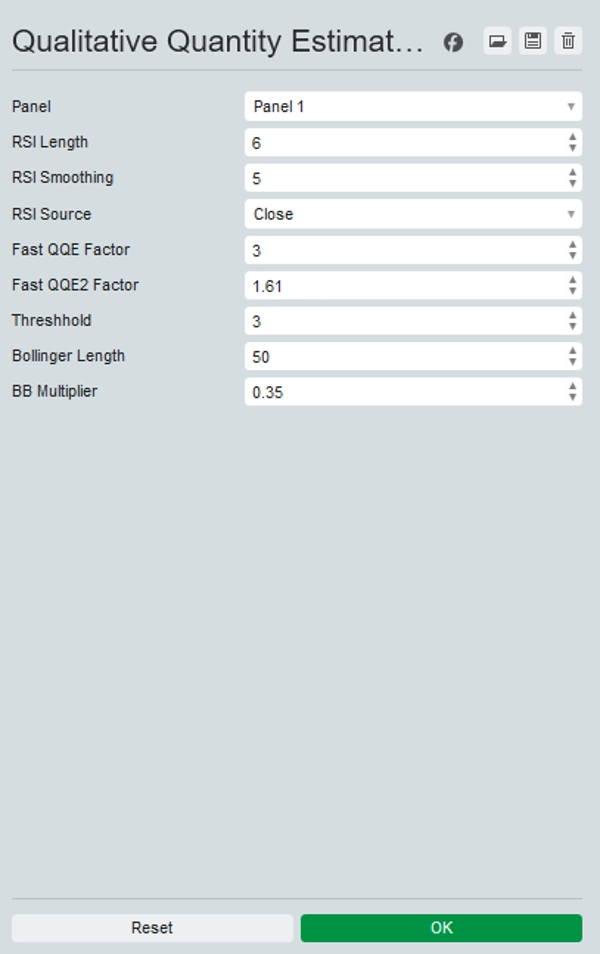
يتم عرض أحد مؤشرات QQE على الرسم البياني كأعمدة، بينما يعمل الآخر في الخلفية مع نطاق بولينجر لفترة 50 يعمل كخط صفري.
تتيح لك هذه الإعدادات قياس زخم السوق بصريًا وتحديد نقاط الدخول المحتملة بوضوح. عندما يتوافق مؤشرا QQE، سترى أشرطة زرقاء أو حمراء واضحة، مما يشير إلى فرص شراء أو بيع قوية.
ارتقِ باستراتيجيتك في التداول مع مؤشر QQE لاتخاذ قرارات أكثر وعيًا وتحسين الدقة في تحليلك للسوق.تقديم مؤشر QQE المتقدم (التقدير الكمي النوعي)، أداة قوية تجمع بين مؤشرين QQE لتعزيز رؤى التداول.
يتم عرض أحد مؤشرات QQE على الرسم البياني كأعمدة، بينما يعمل الآخر في الخلفية مع نطاق بولينجر لفترة 50 يعمل كخط صفري.
تتيح لك هذه الإعدادات قياس زخم السوق بصريًا وتحديد نقاط الدخول المحتملة بوضوح. عندما يتوافق مؤشرا QQE، سترى أشرطة زرقاء أو حمراء واضحة، مما يشير إلى فرص شراء أو بيع قوية.
ارتقِ باستراتيجيتك في التداول مع مؤشر QQE لاتخاذ قرارات أكثر وعيًا وتحسين الدقة في تحليلك للسوق.
الملخص
تقييمات العملاء
5 | 100 % | |
4 | 0 % | |
3 | 0 % | |
2 | 0 % | |
1 | 0 % |


