
E7 Harmonic Structures Basic
مؤشر
647 التنزيلات
الإصدار 1.0، Feb 2025
Windows, Mac
5.0
التقييمات: 2
الوصف
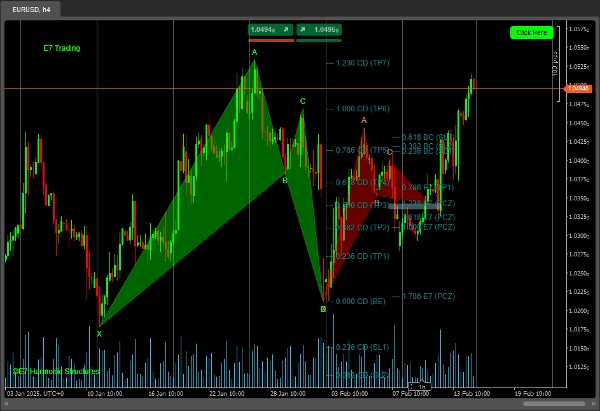
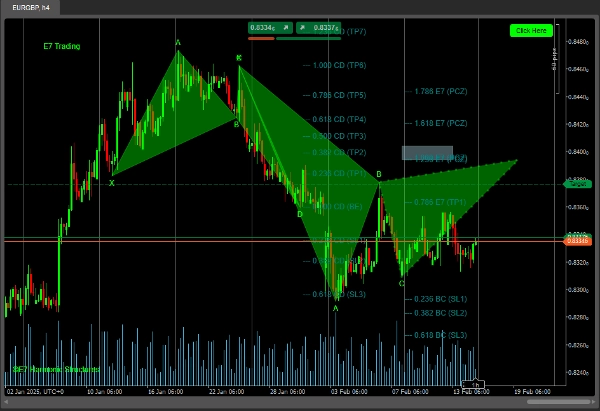
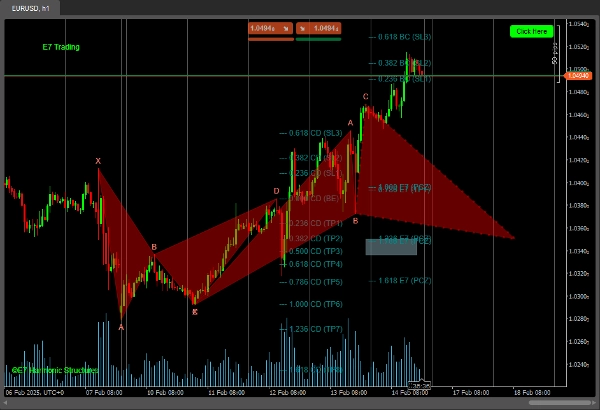
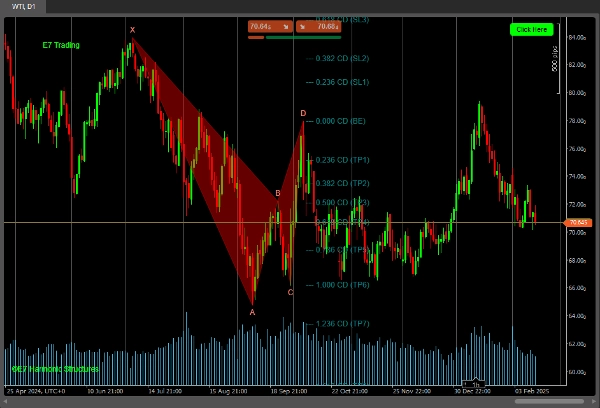
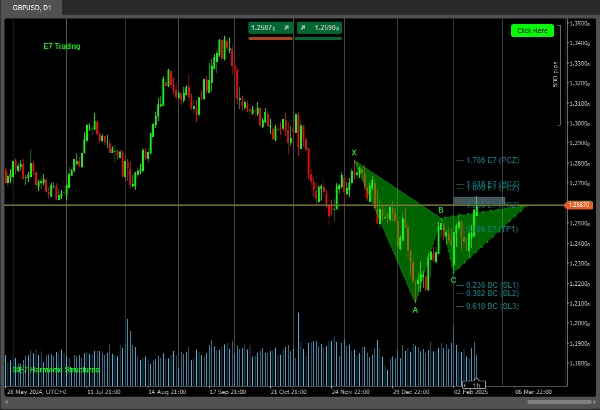
يتضمن مؤشر E7 Harmonic Structures Basic ما يلي:
هياكل النقطة 'C' وهياكل النقطة 'D'.
إسقاطات Fib، PCZ و PRZ لتحليل أفضل، كما هو موضح في استراتيجيات E7.
ومع ذلك، فإنه يشمل فقط عددًا محدودًا من الهياكل التالية:
- Gartley
- Bat
- Butterfly
- Crab
- Cypher
* هذه نسخة تجريبية.
المؤشر الكامل يشمل العديد من الهياكل الأخرى وسيصدر قريبًا.
صيد موفق!
الملخص
ملخص الذكاء الاصطناعي
E7 Harmonic Structures Basic is a technical indicator designed for harmonic pattern analysis in trading. It identifies Point 'C' and Point 'D' structures and incorporates Fibonacci projections, Potential Completion Zones (PCZ), and Potential Reversal Zones (PRZ) to support detailed market analysis as outlined in E7 Strategies. The indicator currently detects a limited set of harmonic patterns, including Gartley, Bat, Butterfly, Crab, and Cypher formations. This version is labeled as Beta, with a more comprehensive version including additional structures planned for future release.
ملف تعريف المؤشر
تقييمات العملاء
5.0
التقييمات: 2
5 | 100 % | |
4 | 0 % | |
3 | 0 % | |
2 | 0 % | |
1 | 0 % |
تقييمات العملاء
August 12, 2025
Pros: Detects Bat, Gartley, Butterfly, Shark patterns automatically with PRZ visualization. Flexible settings. Cons: No tooltips or alerts. Missing pattern history log and template saving. Requires external confirmation (volume or PA).
April 22, 2025
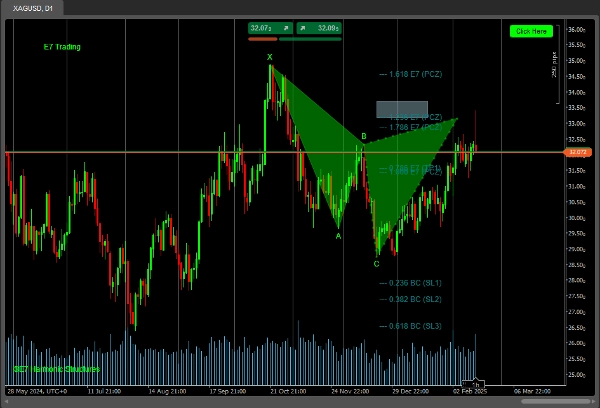
I am currently testing your indicator and I must say it is very interesting. I am a fan of Fibonacci and today, April 22, 2025, it showed two beautiful structures on gold. Like from a book about trading. Best regards and I wish you continued success in improving the product. Artur
مناقشة
الأسئلة الشائعة
يتم توفير المنتجات المتاحة من خلال cTrader Store، بما في ذلك روبوتات التداول والمؤشرات والإضافات، من قبل مطوري الطرف الثالث وإتاحتها لأغراض الوصول المعلوماتي والفني فقط. cTrader Store ليس وسيطًا ولا يقدم نصائح استثمارية أو توصيات شخصية أو أي ضمان للأداء المستقبلي.
المزيد من هذا المؤلف


السعر
منذ 18/12/2024
2
المبيعات
4.26K
التثبيتات المجانية