
E7 Indicators Free Overlays
مؤشر
378 التنزيلات
الإصدار 1.0، Feb 2025
Windows, Mac
5.0
التقييمات: 2
الوصف
تتضمن مؤشرات التراكب المجانية E7 فقط ما يلي
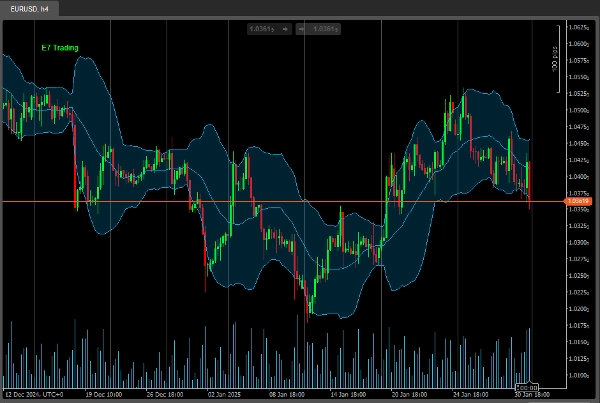
- سحابة بولينجر باند
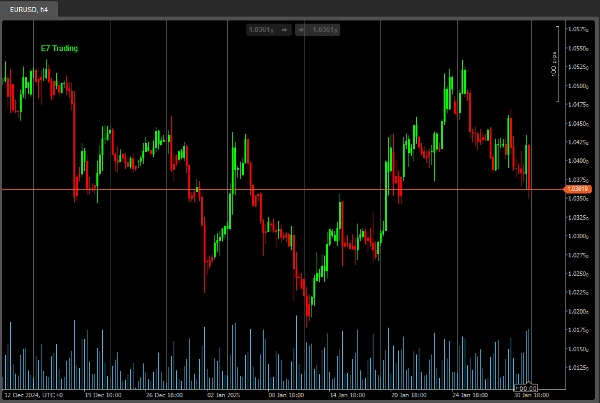
- هيكين آشي
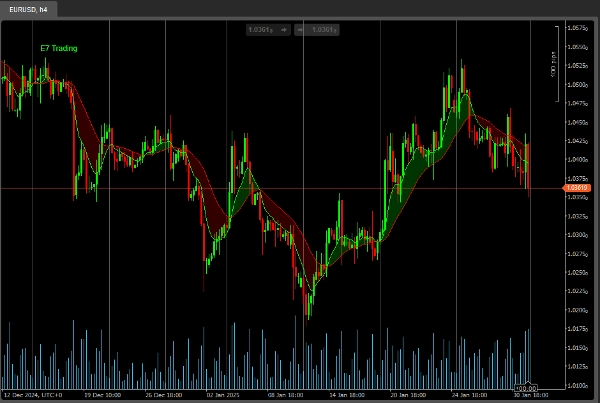
- متابع الاتجاه
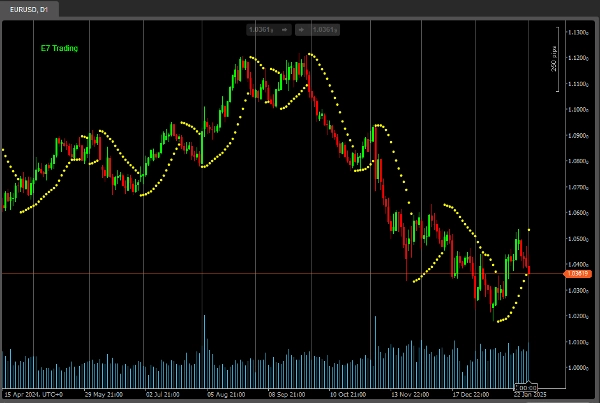
- بارابوليك سار.
صيد موفق!
الملخص
ملخص الذكاء الاصطناعي
E7 Indicators Free Overlays is a collection of four technical overlay indicators designed for trading chart analysis. It includes the Bollinger Band Cloud, which visualizes volatility and potential price ranges; Heiken Ashi, a candlestick variant that smooths price action to identify trends; Trend Follower, an indicator aimed at highlighting prevailing market directions; and Parabolic SAR, which signals potential trend reversals and helps set trailing stop levels. These overlays are applied directly on price charts to assist traders in identifying market trends, volatility, and entry or exit points. The product supports multiple chart types and is suitable for various trading instruments where these indicators are applicable.
ملف تعريف المؤشر
تقييمات العملاء
5.0
التقييمات: 2
5 | 100 % | |
4 | 0 % | |
3 | 0 % | |
2 | 0 % | |
1 | 0 % |
تقييمات العملاء
December 21, 2025
August 18, 2025
Combines multiple tools in one, customizable, versatile. Cons: Can overload chart, slight lag with all features enabled.
مناقشة
الأسئلة الشائعة
Bollinger
يتم توفير المنتجات المتاحة من خلال cTrader Store، بما في ذلك روبوتات التداول والمؤشرات والإضافات، من قبل مطوري الطرف الثالث وإتاحتها لأغراض الوصول المعلوماتي والفني فقط. cTrader Store ليس وسيطًا ولا يقدم نصائح استثمارية أو توصيات شخصية أو أي ضمان للأداء المستقبلي.
المزيد من هذا المؤلف


السعر
منذ 18/12/2024
2
المبيعات
4.26K
التثبيتات المجانية