
Penerangan
📈 Trend Master Pro MultiMA – Alat Pengesan Trend Terunggul 🚀
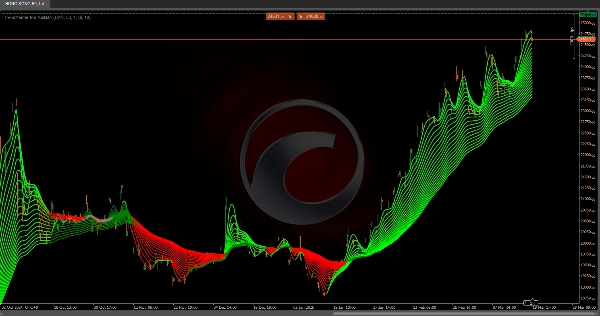
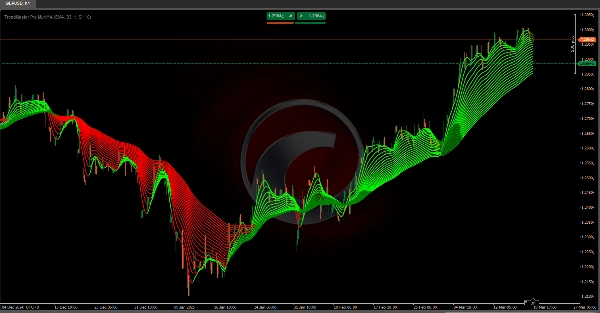
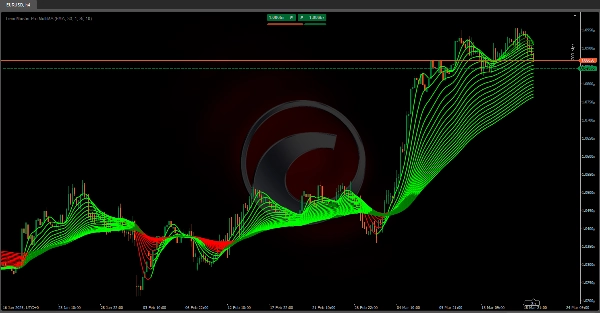
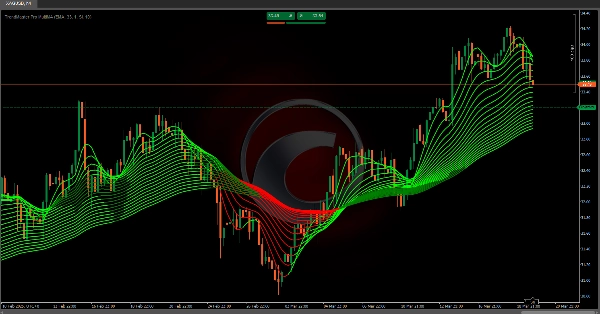
Penunjuk ini memplot 20 purata bergerak dengan tempoh yang berbeza (5, 10, 15, 20, 25, 30, 35, 40, 45, 50, 55, 60, 65, 70, 75, 80, 85, 90, 95, dan 100). Untuk setiap satu:
1️⃣ 📊 Pilih Jenis Pengiraan Anda: Pilih antara SMA, EMA, RMA, WMA, atau VWMA mengikut pilihan anda. Secara pilihan, anda boleh mengaktifkan pelicinan regresi linear untuk mengurangkan bunyi dan mendapatkan trend yang lebih jelas.
2️⃣ 📏 Tetapkan Saluran Rujukan: Satu saluran berasaskan julat harga dikira menggunakan 200 lilin terakhir. Lebar saluran adalah boleh laras, berkembang dengan volatiliti harga yang lebih tinggi dan mengecil dalam pasaran yang lebih tenang.
3️⃣ 📈 Bandingkan Purata Bergerak dengan Saluran: Setiap purata bergerak dianalisis berkaitan dengan ketinggian saluran dan nilai tertinggi & terendahnya sendiri dalam tempoh yang ditetapkan (lalai: 20 lilin).
- 📊 Jika perbezaan antara nilai tertinggi dan terendah purata bergerak melebihi lebar saluran, ia menandakan trend yang kuat (menaik atau menurun).
- ⚖️ Jika perbezaan berada dalam atau hampir dengan saluran, pasaran dianggap neutral atau bergerak dalam julat.
4️⃣ 🎨 Sistem Pewarnaan Berdasarkan Trend: Setiap segmen purata bergerak diwarnakan mengikut kekuatan dan arah trend:
- 🟢 Hijau = Trend menaik dikesan
- 🔴 Merah = Trend menurun dikesan
5️⃣ 📉 Memvisualisasikan Trend: Penunjuk ini menghubungkan setiap nilai purata bergerak dari lilin ke lilin, membentuk struktur seperti kipas garis trend. Setiap purata bergerak menyesuaikan warnanya secara dinamik berdasarkan trend yang dikira.
✅ Mengapa Menggunakan Trend Master Pro MultiMA?
Pendekatan adaptif berbilang jangka masa ini —menggabungkan pelbagai purata bergerak, saluran harga, dan pelicinan regresi— membantu mengenal pasti dengan cepat fasa pasaran:
🔹 Trend menaik ✅
🔹 Trend menurun ❌
🔹 Pergerakan dalam julat/menyamping 🔄
🚀 Sesuai untuk pedagang yang mencari pandangan visual yang jelas untuk membuat keputusan yang lebih baik dalam jangka masa pendek, sederhana, dan panjang! 📊🔥
Penunjuk Kedai Ctrader:
Struktur Pasaran Dinamik
Analisis Titik Pusing
Regresi Linear Fibonacci
Berbilang Jangka Masa
Bias Lilin Berbilang Tahap
Penjejak
Garis Trend Sokongan dan
Rintangan Auto
Ringkasan
Each moving average is compared against this channel and its own highs and lows over a defined period (default 20 candles). If the range of a moving average exceeds the channel width, it signals a strong bullish or bearish trend; if within or near the channel, the market is considered neutral or ranging. The indicator visually represents trends by connecting moving average values candle-to-candle, forming a fan-like structure of trendlines. Trend strength and direction are indicated by color coding: green for bullish and red for bearish trends.
This multi-timeframe adaptive tool integrates multiple moving averages, price channels, and regression smoothing to help traders quickly identify market phases—bullish, bearish, or ranging—across short, medium, and long-term timeframes.
Ulasan pelanggan
5 | 100 % | |
4 | 0 % | |
3 | 0 % | |
2 | 0 % | |
1 | 0 % |


