
الوصف
EMAScalpHistogram: تصور الزخم لإدارة التداول
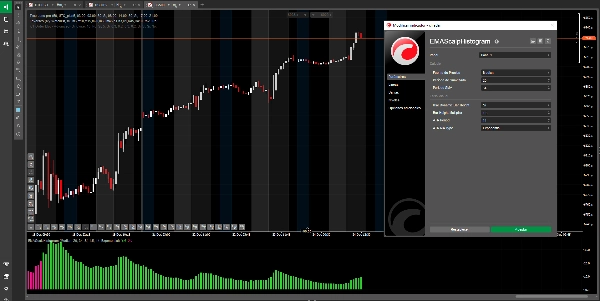
ما هو EMAScalpHistogram؟
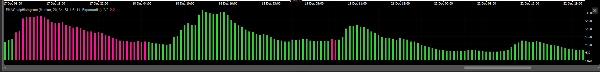
EMAScalpHistogram هو أداة تحليل فني متقدمة تحول تعقيد زخم السوق إلى رسم بياني شريطي بديهي وجذاب بصريًا. يتيح تصميمه التعرف على قوة واتجاه الاتجاه بنظرة واحدة.
- الأشرطة الخضراء (صعودية): تشير إلى زخم شراء قوي، مما يوحي بأن المشترين يسيطرون على السوق.
- الأشرطة الوردية (هبوطية): تشير إلى زخم بيع قوي، مما يوحي بأن البائعين يهيمنون على حركة السعر.
- الارتفاع الديناميكي: ارتفاع الأشرطة ليس ثابتًا؛ بل يتكيف مع تقلبات السوق. الأشرطة الأطول تشير إلى تحركات بقوة وإقناع أكبر، بينما الأشرطة الأقصر تدل على توقف أو ضعف الاتجاه.
الاستخدام الأساسي والاستراتيجية الموصى بها
EMAScalpHistogram هو أداة إدارة تداول متميزة، مصممة للمتداولين الذين يسعون لتعظيم الأرباح من خلال الاحتفاظ بالمراكز بثقة أكبر. تكمن قيمته الكبرى في مساعدتك على الحفاظ على أرباحك وتضخيمها بمجرد دخولك في صفقة.
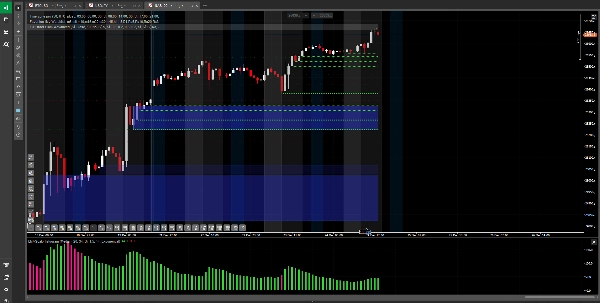
- تأكيد الاتجاه: وظيفته الأقوى هي التحقق من قوة الاتجاه الذي حددته بالفعل. إذا كنت في مركز شراء وأظهر الرسم البياني الشريطي أشرطة خضراء باستمرار، فهذا تأكيد بصري على أن زخم الشراء لا يزال قائمًا.
- إدارة التداول (الاحتفاظ بالأرباح وتضخيمها):
-
- للاحتفاظ بالمراكز: هذا هو التطبيق الأكثر قيمة له. استخدمه لتقرر متى تحتفظ بالمركز بثقة. إذا استمر الرسم البياني الشريطي في عرض أشرطة لصالحك، فإنه يمنحك الانضباط لعدم إغلاق صفقة رابحة مبكرًا بسبب تقلبات سوقية طفيفة.
- لتضخيم الأرباح: من خلال مساعدتك على الاحتفاظ بالمركز طوال مرحلة الزخم القوي بأكملها، يسمح لك بالتقاط تحركات أكبر وتضخيم إمكانات ربحك.
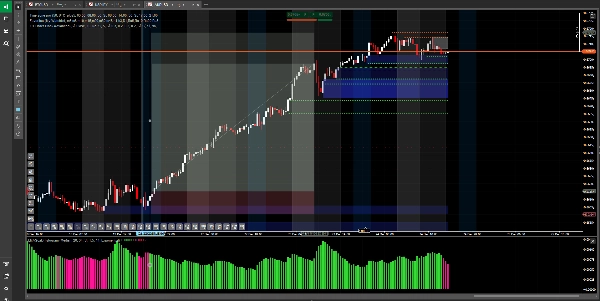
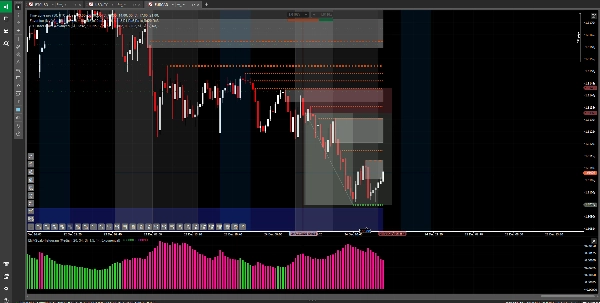
- تنبيه لضعف الزخم: تغيير لون الرسم البياني الشريطي (من الأخضر إلى الوردي أو العكس) هو أحد أول التنبيهات على أن الزخم يضعف، مما يشير إلى أنه قد يكون وقتًا جيدًا لتأمين الأرباح أو تعديل استراتيجية الخروج الخاصة بك.
ما يجب تجنبه
ليس إشارة دخول: من المهم، EMAScalpHistogram ليس مصممًا ليُستخدم كإشارة مستقلة لفتح صفقات جديدة. كمؤشر يؤكد قوة حركة جارية بالفعل، استخدامه للدخول قد يؤدي إلى صفقات متأخرة ذات مخاطر عالية وإمكانات ربح محدودة.
تحذير من المخاطر وإخلاء المسؤولية
استخدام هذا المؤشر هو على مسؤوليتك الخاصة. تداول الأدوات المالية يحمل مستوى عاليًا من المخاطر وقد لا يكون مناسبًا لجميع المستثمرين. هذه الأداة لا تشكل توصية استثمارية أو نصيحة مالية. الأداء السابق ليس ضمانًا للنتائج المستقبلية. يُنصح بشدة باختبار أي استراتيجية على حساب تجريبي قبل المخاطرة برأس مال حقيقي.
الملخص
تقييمات العملاء
5 | 67 % | |
4 | 33 % | |
3 | 0 % | |
2 | 0 % | |
1 | 0 % |


