الوصف
ملف حجم المؤسسات - أداة تحليل السوق المتقدمة
اكتشف أين يتموضع المتداولون المؤسساتيون باستخدام مؤشر ملف الحجم الاحترافي هذا. على عكس أدوات الحجم الأساسية، يكشف هذا المؤشر عن الهيكل الحقيقي للسوق من خلال إظهار المكان الذي حدثت فيه غالبية أنشطة التداول بالضبط.
الميزات الرئيسية:
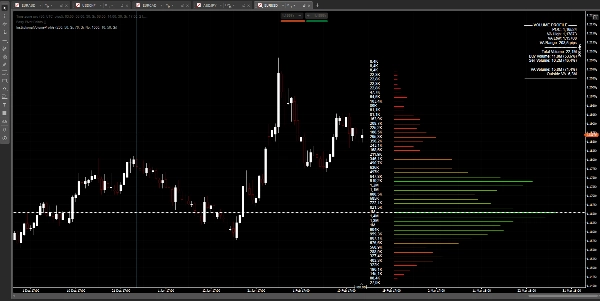
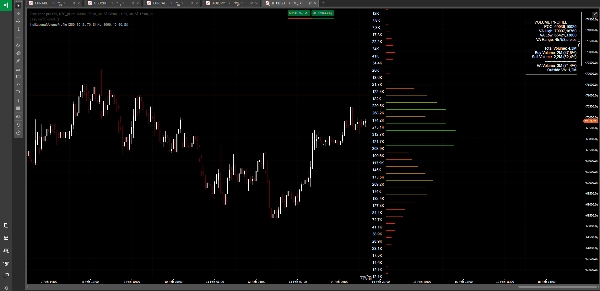
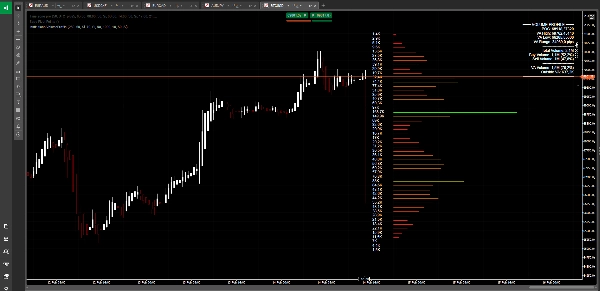
🎯 نقطة التحكم (POC)
تحديد مستوى السعر الذي يحتوي على أعلى حجم تداول على الفور - نقطة توازن السوق حيث تتركز الأنشطة المؤسساتية.
📊 تحليل منطقة القيمة
تصور نطاق السعر الذي يحتوي على 70% من إجمالي حجم التداول. هذا هو المكان الذي توجد فيه "القيمة العادلة" وحيث يميل السعر إلى الجذب.
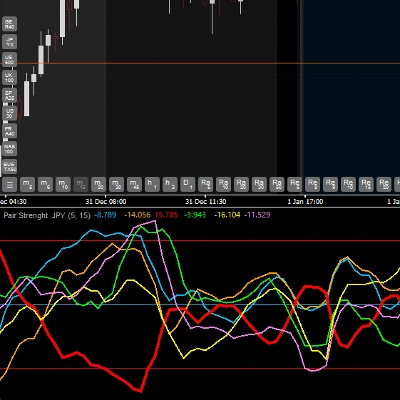
💹 تحليل معنويات الشراء/البيع
شاهد توازن القوة بين المشترين والبائعين مع تقسيمات النسبة المئوية في الوقت الحقيقي. اعرف ما إذا كان الثيران أو الدببة هم المسيطرون.
🎨 تدرج الألوان الذكي
تظهر مناطق الحجم العالي باللون الأخضر الفاتح، بينما تظهر المناطق ذات الحجم المنخفض باللون الأحمر. اكتشف على الفور مناطق السيولة ومناطق الاختراق المحتملة.
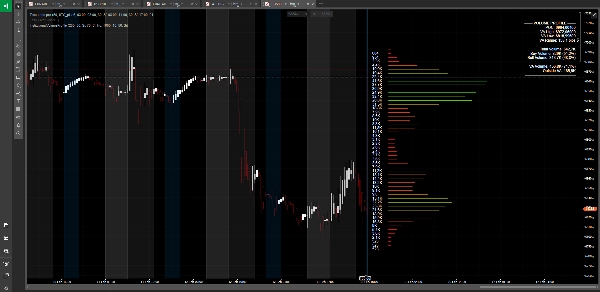
📈 عرض احترافي
عرض نظيف وغير متداخل مع أشرطة الحجم الممتدة بعيداً عن حركة السعر. الأرقام موضوعة بوضوح لسهولة القراءة على أي مستوى تكبير.
⚙️ قابل للتخصيص بالكامل
قم بضبط فترة النظر إلى الوراء، وعدد مستويات السعر، والألوان، وخيارات العرض لتتناسب مع أسلوب تداولك.
مثالي لـ:
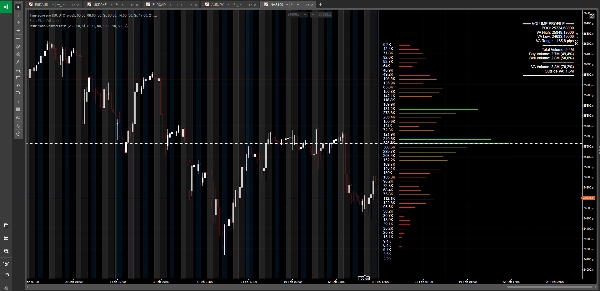
• تحديد مستويات الدعم والمقاومة الرئيسية
• اكتشاف العقد ذات الحجم المنخفض (LVN) للاختراقات المحتملة
• إيجاد العقد ذات الحجم العالي (HVN) حيث قد يتماسك السعر
• فهم تموضع المؤسسات
• تأكيد دخول وخروج الصفقات
• تحليل متعدد الأطر الزمنية
سواء كنت متداول يومي، متداول تأرجحي، أو متداول موقعي، تمنحك هذه الأداة الأفضلية من خلال إظهار ما لا تستطيع المؤشرات التقليدية إظهاره: أين تعمل الأموال الذكية.
---
⚠️ إخلاء مسؤولية المخاطر:
ينطوي تداول العملات الأجنبية، والعملات المشفرة، والأدوات المالية الأخرى على مستوى عالٍ من المخاطر وقد لا يكون مناسبًا لجميع المستثمرين. يمكن أن يعمل الرفع المالي العالي ضدك وكذلك لصالحك. قبل اتخاذ قرار التداول، يجب أن تنظر بعناية في أهداف استثمارك، ومستوى خبرتك، وقدرتك على تحمل المخاطر. هناك احتمال أن تتكبد خسارة لبعض أو كل استثمارك. لذلك، يجب ألا تستثمر أموالًا لا يمكنك تحمل خسارتها. يجب أن تكون على دراية بجميع المخاطر المرتبطة بالتداول وطلب المشورة من مستشار مالي مستقل إذا كان لديك أي شكوك. الأداء السابق لا يشير إلى النتائج المستقبلية.
الملخص
- Point of Control (POC): Identifies the price level with the highest trading volume, indicating market equilibrium.
- Value Area Analysis: Displays the price range containing 70% of trading volume, representing the "fair value" zone.
- Buy/Sell Sentiment Analysis: Provides real-time percentage breakdowns of buying and selling pressure.
- Smart Color Gradient: Uses color coding to distinguish high-volume zones (bright green) from low-volume zones (red), aiding in spotting liquidity and breakout areas.
- Professional Presentation: Volume bars extend from price action with clear numeric labels, optimized for readability at any zoom level.
- Full Customization: Allows adjustment of lookback period, price levels, colors, and display settings.
This tool supports multi-timeframe analysis and is suitable for identifying key support/resistance levels, spotting low- and high-volume nodes, understanding institutional positioning, and confirming trade entries and exits. It is applicable across markets including Forex, indices, and symbols like XAUUSD and NAS100.
تقييمات العملاء
5 | 33 % | |
4 | 33 % | |
3 | 0 % | |
2 | 33 % | |
1 | 0 % |