الوصف
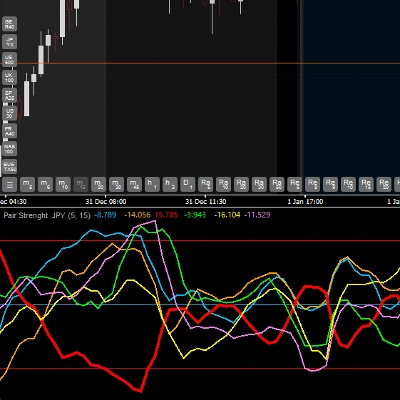
مؤشر قوة الزوج (JPY) - مؤشر قوة العملة
📊 ما هو مؤشر قوة الزوج (JPY)؟
مؤشر قوة الزوج (JPY) هو مؤشر متقدم يحلل ويقارن القوة النسبية لست عملات رئيسية في الوقت الحقيقي: EUR, GBP, JPY, USD, AUD, و CAD. يستخدم مؤشر القوة الحقيقية (TSI) لقياس الزخم والقوة لكل عملة، مما يسمح لك بتحديد أي العملات أقوى أو أضعف في السوق.
🎯 الميزات الرئيسية
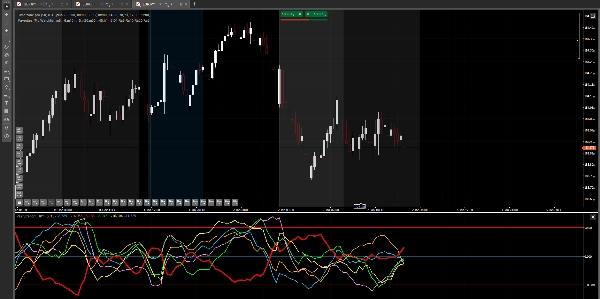
✅ تحليل متعدد العملات: مراقبة 6 عملات في نافذة واحدة في نفس الوقت ✅ تحديد الاتجاه: اكتشاف أقوى وأضعف العملات في السوق ✅ إشارات التشبع الشرائي/البيعي: مستويات عند 50، 0، و -50 لتحديد الحالات القصوى ✅ تأكيد التداول: يساعد في التحقق من صحة دخولك من خلال مقارنة القوة النسبية ✅ مرئي وواضح: لكل عملة لون خاص بها لتسهيل التعرف عليها
💹 الأزواج المتوافقة
مهم: هذا المؤشر يحلل قوة 6 عملات: EUR, GBP, JPY, USD, AUD, و CAD
يعمل المؤشر فقط مع الأزواج التي تشمل JPY (الين الياباني)، مما يعني:
- EURJPY (اليورو / الين)
- GBPJPY (الجنيه / الين)
- USDJPY (الدولار / الين)
- AUDJPY (الدولار الأسترالي / الين)
- CADJPY (الدولار الكندي / الين)
⚠️ يجب أن يقدم وسيطك هذه الأزواج الخمسة مع JPY لكي يعمل المؤشر بشكل صحيح.
لا يعمل مع:
- الذهب، الفضة، أو المعادن الأخرى
- مؤشرات الأسهم
- العملات المشفرة
- الأزواج التي لا تشمل JPY (مثل EURUSD، GBPUSD، إلخ)
يمكنك تطبيق المؤشر على مخطط أي من الأزواج الخمسة المذكورة أعلاه.
📈 كيفية استخدام المؤشر
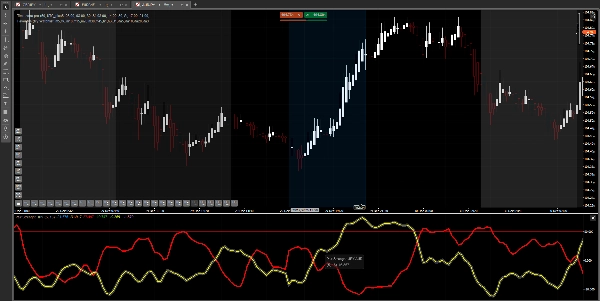
تفسير الخط:
يمثل كل خط ملون قوة عملة:
- الخط صاعد (قيم إيجابية): العملة قوية
- الخط هابط (قيم سلبية): العملة ضعيفة
- تقاطع الخطوط: تغيير في القوة النسبية بين العملات
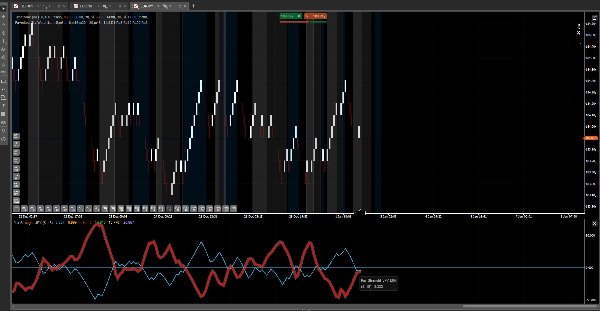
المستويات الرئيسية:
- المستوى 50: منطقة التشبع الشرائي - قد تكون العملة قوية جداً وقريبة من الانعكاس
- المستوى 0: الخط المحايد - توازن بين القوة والضعف
- المستوى -50: منطقة التشبع البيعي - قد تكون العملة ضعيفة جداً وقريبة من الانعكاس
الاستراتيجية الأساسية:
- تحديد أقوى عملة (أعلى خط)
- تحديد أضعف عملة (أدنى خط)
- تداول الزوج الذي يجمع بينهما (مثال: إذا كانت EUR قوية و JPY ضعيفة → اشترِ EURJPY)
- التأكيد بالمستويات: تجنب الشراء عندما تكون العملة القوية عند +50 أو البيع عندما تكون العملة الضعيفة عند -50
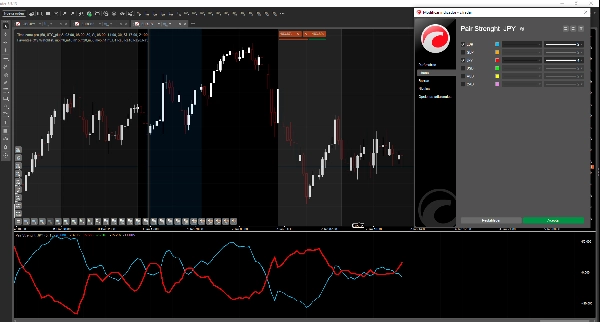
⚙️ المعلمات القابلة للتعديل
- الفترة السريعة (الافتراضي: 5): فترة TSI السريعة - القيم الأقل = حساسية أعلى
- الفترة البطيئة (الافتراضي: 15): فترة TSI البطيئة - القيم الأعلى = أكثر سلاسة
القيم الافتراضية تعمل جيداً في معظم الحالات. قم بضبطها وفقاً لأسلوب تداولك.
🔮 التحديثات المستقبلية
نحن ندرس إمكانية إضافة أزواج عملات أخرى (NZD, CHF، إلخ) في الإصدارات المستقبلية، اعتماداً على ردود المستخدمين وتعليقاتهم. ومع ذلك، هذا غير مضمون وسيعتمد على أداء المؤشر وطلب السوق.
💡 نصائح الاستخدام
✓ استخدمه مع استراتيجيتك الرئيسية، وليس كنظام مستقل ✓ اجمعه مع تحليل حركة السعر ومستويات الدعم/المقاومة ✓ تدرب أولاً على حساب تجريبي قبل التداول الحقيقي ✓ ليست كل الإشارات رابحة - طبق إدارة مخاطر مناسبة ✓ يعمل بشكل أفضل على أطر زمنية M15 وما فوق
📞 الدعم
إذا كان لديك أسئلة حول تثبيت أو استخدام المؤشر، اتصل بنا.
ملاحظة نهائية: هذا المؤشر هو أداة تحليل. نجاح التداول يعتمد على عوامل متعددة بما في ذلك إدارة المخاطر، النفسية، والخبرة.
الملخص
This tool works exclusively with currency pairs that include the Japanese Yen (JPY), specifically EURJPY, GBPJPY, USDJPY, AUDJPY, and CADJPY. It does not support metals, stock indices, cryptocurrencies, or pairs without JPY. Users apply the indicator on any of the five JPY pairs to monitor multi-currency strength simultaneously in one window.
Adjustable parameters include the fast and slow periods of the TSI for sensitivity and smoothing. The indicator aids in trend identification, overbought/oversold signal detection, and trade confirmation by comparing relative currency strength. It is recommended for use alongside other analysis methods and on timeframes of 15 minutes or higher.
تقييمات العملاء
5 | 100 % | |
4 | 0 % | |
3 | 0 % | |
2 | 0 % | |
1 | 0 % |


![شعار "High-Low Divergence [Iridio Capital]"](https://cdn.ctrader.com/image/webp/443c4661-7abb-40f1-842f-4b6ec560649b_40914)


