present
سجل واحصل على خصم 50 دولارًا على مشترياتك الأولى
Trading product for IR VLine مؤشر, image 1
IR VLine
5.0
التقييمات: 1
5.64K
التثبيتات المجانية

الوصف

لا تتحرك إلى نهاية المخطط بعد تغيير الإطار الزمني.

من الأفضل استخدامه للتاريخ القريب. للتاريخ الطويل، هناك تأخير.

الملخص

ملخص الذكاء الاصطناعي
IR VLine is a chart indicator designed to maintain the current chart position without automatically moving to the end after changing the timeframe. It is optimized for analyzing recent market history, providing timely visual references for near-term data. When applied to longer historical periods, users may experience some delay in updates. This tool supports traders who require stable chart positioning during timeframe adjustments for short-term analysis.
ملف تعريف المؤشر

مناقشة

تقييمات العملاء

5.0
التقييمات: 1
5
100 %
4
0 %
3
0 %
2
0 %
1
0 %
تقييمات العملاء
September 30, 2025
Very useful and handy tool

الأسئلة الشائعة

يتم توفير المنتجات المتاحة من خلال cTrader Store، بما في ذلك روبوتات التداول والمؤشرات والإضافات، من قبل مطوري الطرف الثالث وإتاحتها لأغراض الوصول المعلوماتي والفني فقط. cTrader Store ليس وسيطًا ولا يقدم نصائح استثمارية أو توصيات شخصية أو أي ضمان للأداء المستقبلي.


المزيد من هذا المؤلف

شعار "IR Candle MTF"
4.6
(6)
مجاني
with this indicator you could see other time frame candle in your chart.
show spread on chart
some user add moving average to macd to see better. in ctrader 4.3.11 there is a problem with this . I make a macd tha
this indicator show macd on chart.
Multi Time Frame Moving Average is a powerful and flexible indicator for cTrader
 this moving include everything that a trader needs from Moving Average.
this indicaotr show distance between Tenkan to Kijun, Close to Kijun and Close to Tenkan 
Add Slowing to IR Moving Average.
IR Candle Open plots customizable opening price lines for daily, weekly, and monthly candles
Coral indicator
you could put your check list in your chart you could split your test with “,” you could put your checklist in indicat
this indicator show other time frame close in lower time frame. for ex: show daily close in m 15.

قد يعجبك أيضًا

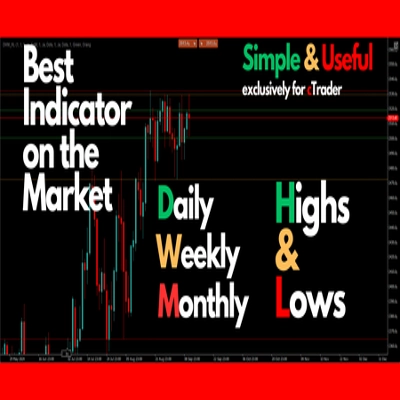
Daily/Weekly/Monthly - Highs & Lows Indicator (Customizable Settings)
Dynamic, color‑coded candles reveal market shifts instantly—spot momentum and trend reversals at a glance
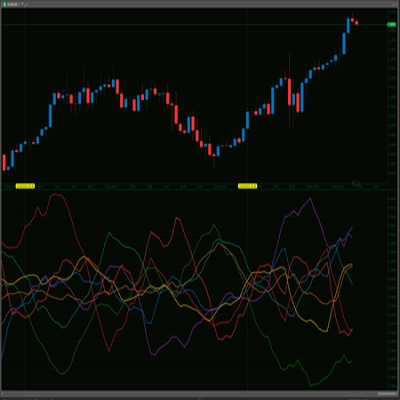
RCS: 8 majors! AUD,USD,EUR,JPY,GBP,CAD,CHF,NZD. Find how strong each currency is relatively and trade smarter!
The TrendFibonacci indicator is a powerful tool for traders, combining Fibonacci retracement levels
شعار "SupertrendChannels"
4.7
(4)
$19
/
$20
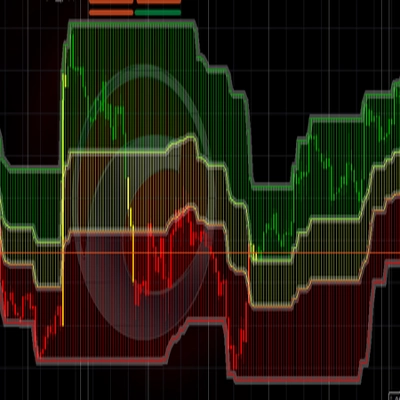
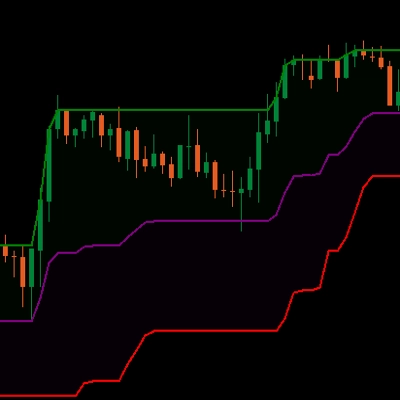
Supertrend-based channel for entries, trailing stops, and dynamic support/resistance zones.
A function demo version of VWAP indicator with std. dev. bands. Expired on 1st Aug, 2025.
Detects market regime - Optimized for BTC/USD - with adaptive EMAs, Hurst, ADX & confidence score.
شعار "Order Block"
4.8
(5)
$19
Identify bullish and bearish Order Blocks to spot key support/resistance levels and potential trend reversals! 📈🔄
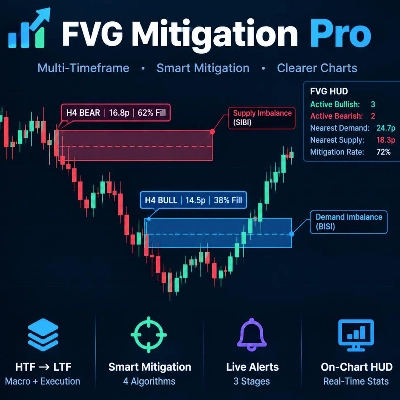
Fair Value Gap scanner with live fill telemetry, 50% CE lines, 4 mitigation rules, and a 3-stage native alert system.
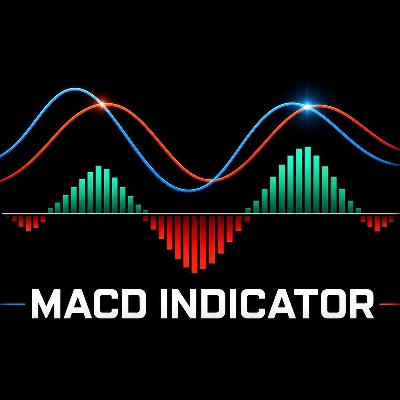
MACD indicator modeled after TradingView, featuring a 4-color momentum histogram, sound/pop-up crossover alerts.
شعار "OR Session Zones"
4.2
(5)
$25
/
$45
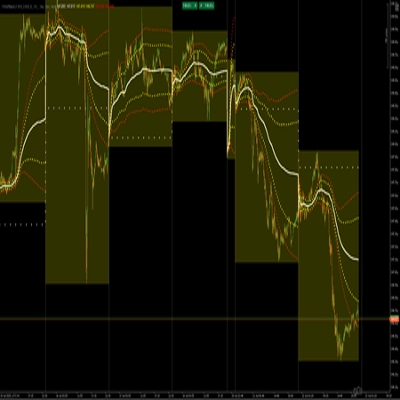
A high‑precision Opening Range indicator that detects session opens (NY, London, EU, Tokyo, Shanghai)
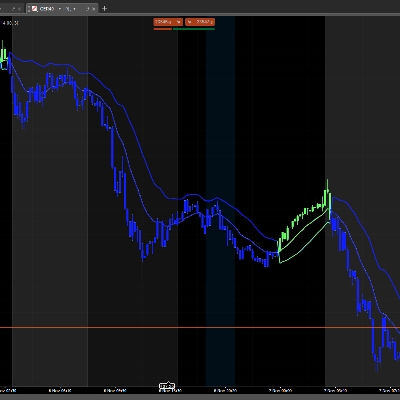
Opening ranges, dynamic trend channels, and multi-scale breakout/retest analysis for clear intraday chart decisions.
Configure, simulate, and analyze trading strategies with custom filters, multi-target exits, and detailed performance me
Perfect Trend
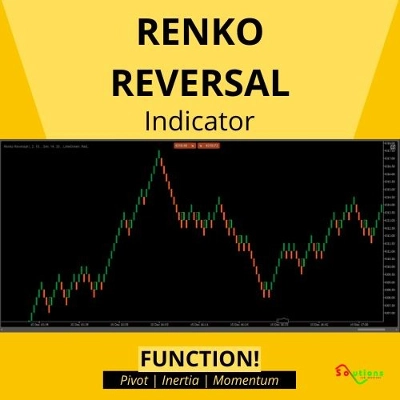
The best filter for trading trend continuations on Renko charts.
The traditional Hull Moving Average with different colours based on the slope (direction) of the trend.
Map market structure, order blocks, liquidity and key zones with an interactive cTrader dashboard.
Strong Supertrend Turn Market Movement into a Clear Map Market analysis

السعر

5.64K
التثبيتات المجانية