
IR Ichimoku Macd
지표
226 다운로드
버전 1.0, Jan 2025
Windows, Mac
5.0
리뷰: 1
설명
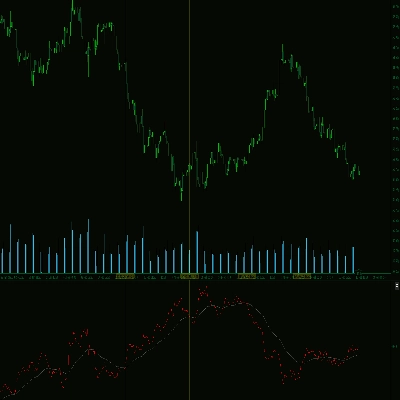
이 지표는 텐칸과 키준 사이의 거리, 키준과 종가 사이의 거리, 텐칸과 종가 사이의 거리를 보여줍니다
요약
AI 요약
The IR Ichimoku Macd indicator displays the distances between key Ichimoku components: Tenkan to Kijun, Close to Kijun, and Close to Tenkan. It provides a visual measure of the relative positioning of these elements, which are commonly used in technical analysis to assess market trends and momentum. This indicator helps traders evaluate the relationship between price and Ichimoku lines for potential trading signals.
지표 프로필
고객 리뷰
5.0
리뷰: 1
5 | 100 % | |
4 | 0 % | |
3 | 0 % | |
2 | 0 % | |
1 | 0 % |
고객 리뷰
August 18, 2025
Pros: Combines Ichimoku and MACD for both trend and momentum analysis. Flexible settings and clear visualization. Cons: No alerts, MTF mode, or preset saving. Can be resource-heavy on low-end PCs.
상담
자주 묻는 질문(FAQ)
트레이딩 봇, 지표, 플러그인 등 cTrader Store에서 제공되는 상품은 제3자 개발자에 의해 제공되며, 이는 단순히 정보 및 기술적 접근을 목적으로 제공된 것입니다. cTrader Store는 중개인이 아니며, 투자 조언, 개인별 추천 또는 향후 성과에 대한 어떠한 보장도 제공하지 않습니다.


좋아하실 만한 다른 항목


가격
5.16K
무료 설치