الوصف
متوسط متحرک چند بازه زمانی هوشمند و انعطافپذیر برای cTrader است که به شما امکان میدهد متوسط متحرک محاسبه شده از هر بازه زمانی را مستقیماً روی نمودار فعلی خود نمایش دهید.
برخلاف اندیکاتور متوسط متحرک استاندارد، این نسخه گزینههای پیشرفته سفارشیسازی را ارائه میدهد و برای معاملهگرانی که از تحلیل چند بازه زمانی در استراتژیهای معاملاتی خود استفاده میکنند مناسب است.
ویژگیها
- نمایش متوسط متحرک از هر بازه زمانی روی نمودار فعلی.
- پشتیبانی از چندین روش متوسط متحرک:
-
- ساده (SMA)
- نمایی (EMA)
- هموار شده (SMMA)
- وزنی خطی (LWMA)
- وایلدر
- انتخاب از منابع مختلف قیمت:
-
- بسته شدن
- باز شدن
- بالاترین
- پایینترین
- قیمت میانه
- قیمت معمول
- قیمت وزنی
- دوره متوسط متحرک قابل تنظیم.
- جابجایی (شیفت) متوسط متحرک به جلو یا عقب.
- رنگها، ضخامت و سبک خط کاملاً قابل تنظیم.
- محاسبه دقیق چند بازه زمانی با نمایش نرم.
- قابل استفاده روی تمام نمادها و تمام بازههای زمانی.
مناسب برای
این اندیکاتور به ویژه برای معاملهگرانی مفید است که:
- با استفاده از تحلیل چند بازه زمانی معامله میکنند.
- از روندهای بازه زمانی بالاتر برای تأیید ورود استفاده میکنند.
- میخواهند سطوح حمایت و مقاومت پویا را نظارت کنند.
- میانگینهای متحرک را با استراتژیهای پرایس اکشن ترکیب میکنند.
چه شما اسکالپر، معاملهگر روزانه یا نوسانگیر باشید، این اندیکاتور به شما کمک میکند جهت بازار بازه زمانی بالاتر را بدون نیاز به جابجایی بین نمودارها مشاهده کنید.
برای حمایت از ما جهت دریافت اندیکاتورهای رایگان بیشتر لطفاً از لینک زیر استفاده کرده و در بروکر ثبتنام کنید
🇮🇷 توضیحات فارسی
مووینگ اوریج مولتی تایمفریم
اندیکاتور Multi Time Frame Moving Average یک ابزار حرفهای برای cTrader است که به شما امکان میدهد مووینگ اوریج هر تایمفریمی را مستقیماً روی چارت فعلی نمایش دهید.
برخلاف مووینگ اوریج پیشفرض سیتریدر، این اندیکاتور امکانات بیشتری برای شخصیسازی در اختیار شما قرار میدهد و برای معاملهگرانی که از تحلیل چند تایمفریمی استفاده میکنند بسیار کاربردی است.
امکانات
- نمایش مووینگ اوریج هر تایمفریم روی چارت فعلی
- پشتیبانی از انواع مووینگ اوریج:
-
- SMA
- EMA
- SMMA
- LWMA
- Wilder's Moving Average
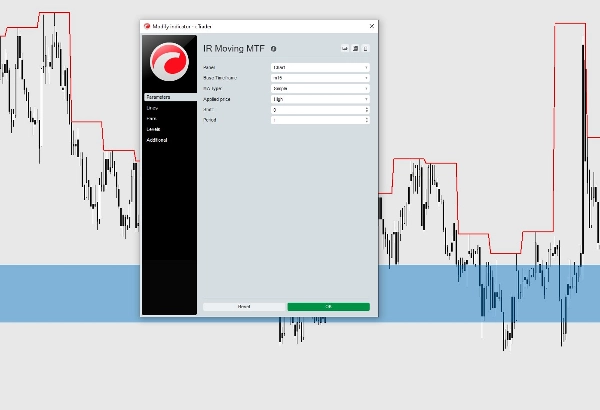
- انتخاب نوع قیمت محاسبه:
-
- Close
- Open
- High
- Low
- Median Price
- Typical Price
- Weighted Price
- قابلیت تنظیم دوره (Period)
- امکان جابهجایی (Shift/Offset) مووینگ اوریج به جلو یا عقب
- تنظیم کامل رنگ، ضخامت و استایل خط
- محاسبات دقیق در حالت Multi Time Frame
- قابل استفاده روی تمام نمادها و تمام تایمفریمها
مناسب برای
این اندیکاتور برای معاملهگرانی مناسب است که:
- از تحلیل چند تایمفریمی استفاده میکنند.
- روند تایمفریمهای بالاتر را برای تأیید ورود بررسی میکنند.
- از مووینگ اوریج بهعنوان حمایت و مقاومت داینامیک استفاده میکنند.
- استراتژی معاملاتی آنها بر پایه Price Action و Moving Average است.
این ابزار به شما کمک میکند بدون نیاز به جابهجایی بین تایمفریمها، روند تایمفریمهای بالاتر را مستقیماً روی نمودار فعلی مشاهده کنید.