
IR Ichimoku Macd
مؤشر
222 التنزيلات
الإصدار 1.0، Jan 2025
Windows, Mac
5.0
التقييمات: 1
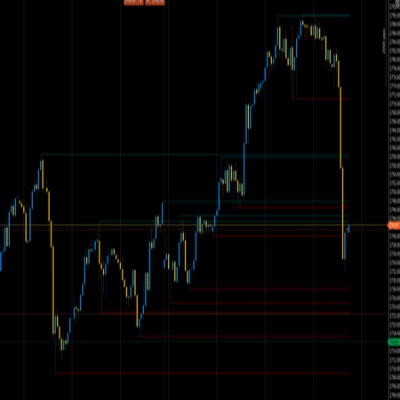
الوصف
هذا المؤشر يعرض المسافة بين التنكان إلى الكيجون، الإغلاق إلى الكيجون والإغلاق إلى التنكان
الملخص
ملخص الذكاء الاصطناعي
The IR Ichimoku Macd indicator displays the distances between key Ichimoku components: Tenkan to Kijun, Close to Kijun, and Close to Tenkan. It provides a visual measure of the relative positioning of these elements, which are commonly used in technical analysis to assess market trends and momentum. This indicator helps traders evaluate the relationship between price and Ichimoku lines for potential trading signals.
ملف تعريف المؤشر
تقييمات العملاء
5.0
التقييمات: 1
5 | 100 % | |
4 | 0 % | |
3 | 0 % | |
2 | 0 % | |
1 | 0 % |
تقييمات العملاء
August 18, 2025
Pros: Combines Ichimoku and MACD for both trend and momentum analysis. Flexible settings and clear visualization. Cons: No alerts, MTF mode, or preset saving. Can be resource-heavy on low-end PCs.
مناقشة
الأسئلة الشائعة
يتم توفير المنتجات المتاحة من خلال cTrader Store، بما في ذلك روبوتات التداول والمؤشرات والإضافات، من قبل مطوري الطرف الثالث وإتاحتها لأغراض الوصول المعلوماتي والفني فقط. cTrader Store ليس وسيطًا ولا يقدم نصائح استثمارية أو توصيات شخصية أو أي ضمان للأداء المستقبلي.


قد يعجبك أيضًا

![شعار "[Hamster-Coder] Price"](https://cdn.ctrader.com/image/webp/893fb641-d5b3-44d8-91fb-6a2dc6f3d309_30647)


السعر
5.12K
التثبيتات المجانية