
IR Spread
Chỉ báo
544 lượt tải
Phiên bản 1.0, Jan 2025
Windows, Mac
5.0
Đánh giá: 2
Mô tả
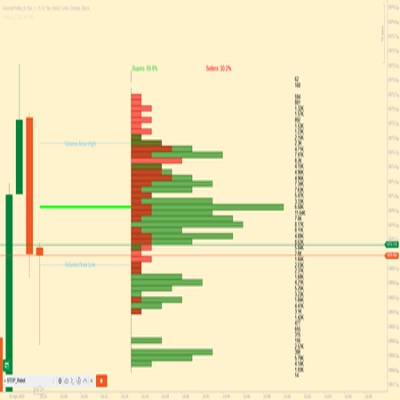
hiển thị spread khi cập nhật biểu đồ
Kênh Telegram hỗ trợ chúng tôi để có thêm nhiều chỉ báo và bot miễn phí hơn
Tóm tắt
Tóm tắt AI
IR Spread is a trading indicator designed to display the spread directly on the chart during updates. It provides real-time visualization of the spread, helping traders monitor this key metric within their trading platform interface. The indicator integrates seamlessly with chart updates, ensuring that spread information is current and easily accessible.
Hồ sơ chỉ báo
Đánh giá của khách hàng
5.0
Đánh giá: 2
5 | 100 % | |
4 | 0 % | |
3 | 0 % | |
2 | 0 % | |
1 | 0 % |
Đánh giá của khách hàng
November 18, 2025
Thảo luận
Câu hỏi thường gặp
Các sản phẩm có sẵn trên cTrader Store, bao gồm bot giao dịch, chỉ báo và plugin, được cung cấp bởi các nhà phát triển bên thứ ba và chỉ nhằm mục đích cung cấp thông tin và tiếp cận kỹ thuật. cTrader Store không phải là nhà môi giới và không cung cấp lời khuyên đầu tư, khuyến nghị cá nhân hay bất kỳ đảm bảo nào về hiệu suất trong tương lai.
Sản phẩm khác của tác giả này


Giá
5.16K
Cài đặt miễn phí