present
新規登録で初回購入時に$50オフ
Trading product for IR Ichimoku Macd インジケーター, image 1
IR Ichimoku Macd
5.0
レビュー: 1
5.66K
無料インストール

説明

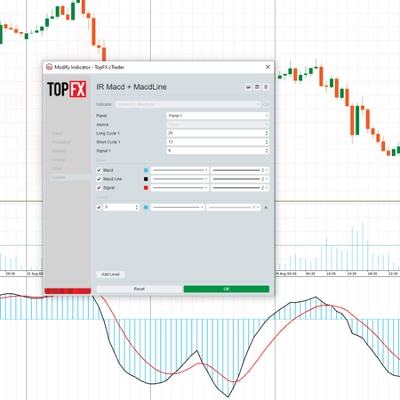
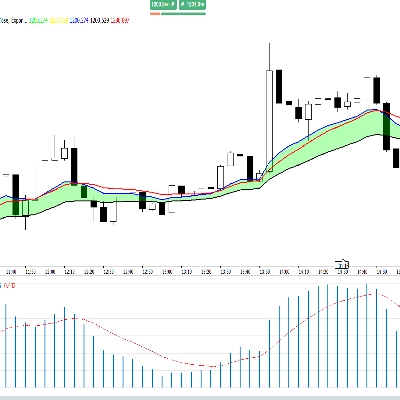
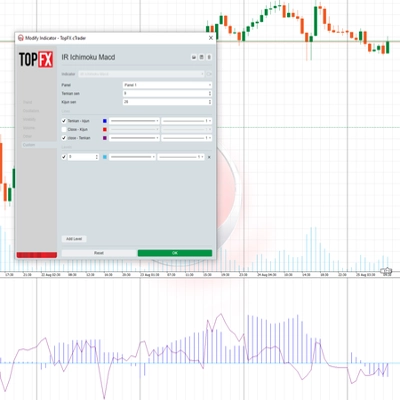
このインジケーターは、転換線から基準線までの距離、終値から基準線までの距離、終値から転換線までの距離を表示します 


概要

AIによる概要
The IR Ichimoku Macd indicator displays the distances between key Ichimoku components: Tenkan to Kijun, Close to Kijun, and Close to Tenkan. It provides a visual measure of the relative positioning of these elements, which are commonly used in technical analysis to assess market trends and momentum. This indicator helps traders evaluate the relationship between price and Ichimoku lines for potential trading signals.
インジケーターのプロフィール

ディスカッション

カスタマーレビュー

5.0
レビュー: 1
5
100 %
4
0 %
3
0 %
2
0 %
1
0 %
カスタマーレビュー
August 18, 2025
Pros: Combines Ichimoku and MACD for both trend and momentum analysis. Flexible settings and clear visualization. Cons: No alerts, MTF mode, or preset saving. Can be resource-heavy on low-end PCs.

よくあるご質問

cTrader Storeで入手可能な取引ボット、インジケーター、プラグインなどの商品は、第三者の開発者が提供するものであり、情報と技術の取得のみを目的としてご利用いただけます。cTrader Storeはブローカーではなく、投資助言や個人的な推奨を行うことも、将来のパフォーマンスを保証することもありません。
この作成者の他の商品

「IR Candle MTF」ロゴ
4.6
(6)
無料
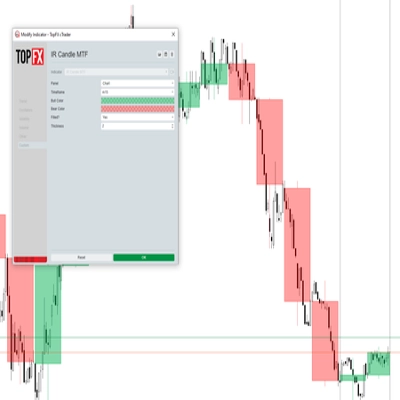
with this indicator you could see other time frame candle in your chart.
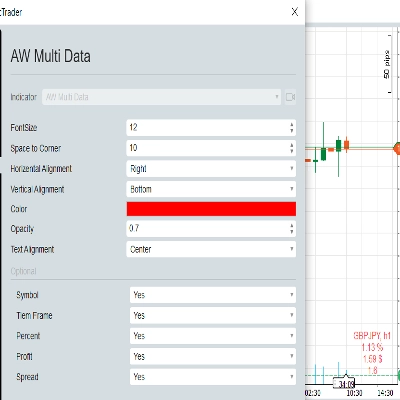
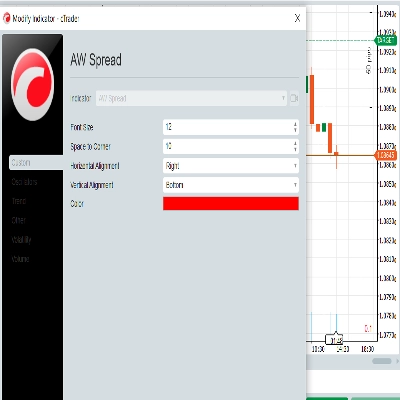
show spread on chart
some user add moving average to macd to see better. in ctrader 4.3.11 there is a problem with this . I make a macd tha
this indicator show macd on chart.
Multi Time Frame Moving Average is a powerful and flexible indicator for cTrader
 this moving include everything that a trader needs from Moving Average.
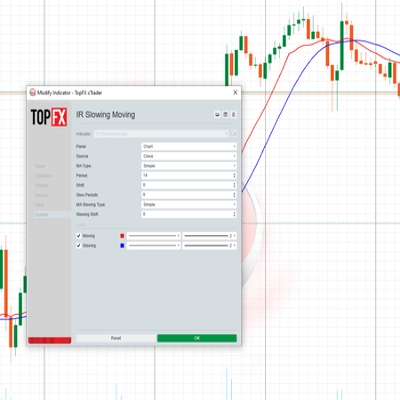
Add Slowing to IR Moving Average.
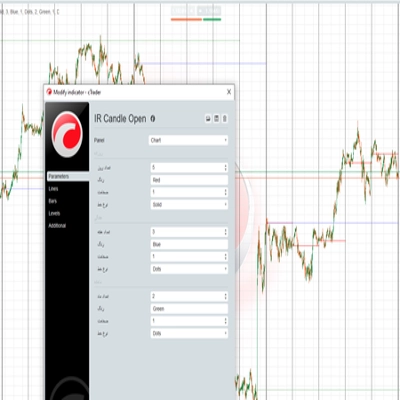
IR Candle Open plots customizable opening price lines for daily, weekly, and monthly candles
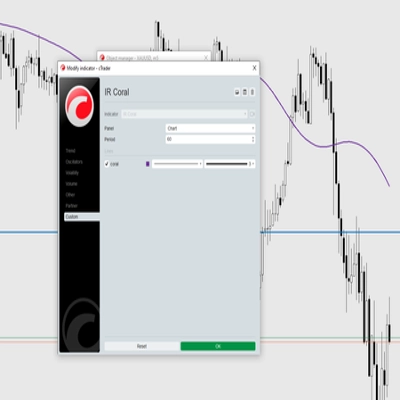
Coral indicator
you could put your check list in your chart you could split your test with “,” you could put your checklist in indicat
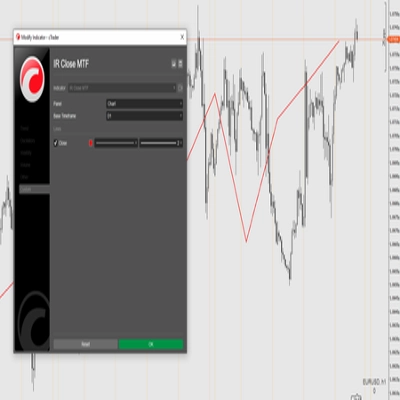
this indicator show other time frame close in lower time frame. for ex: show daily close in m 15.
don't move to the end of chart after timeframe changing. it should be better to use for near history. for long history

これも好きかも

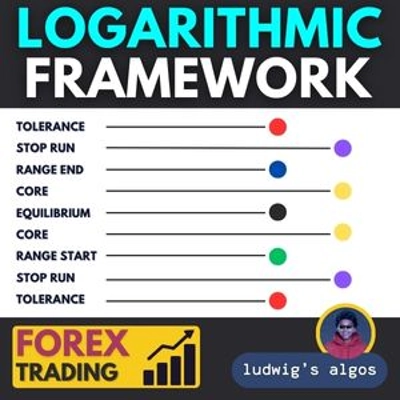
Logarithmic Framework by LudwigICT
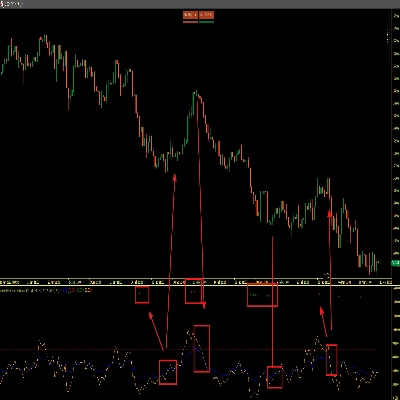
The Mean Reversion Indicator is designed to identify potential reversal points in the market.
Trend-filtered signals, transparent trade plans and a multi-timeframe decision panel for cTrader.
The Volume Delta Indicator using Institutional Level 2 DOM Data, The Edge Institutions Pay Millions For, now on cTrader
「PivotLevels」ロゴ
4.7
(4)
$25
/
$30
It draws Pivot Levels on the chart.
ZigZag Pro — Advanced swing detection with ATR threshold, fractal confirmation, and colored segments. Clean market
Volume profile key levels - POC, value area, volume peaks and troughs - with break, rejection and retest signals
Session Volume Profile for London and New York sessions showing POC levels
VWAP Bands indicator with 3 standard deviation levels, buy/sell zones, and a draggable ON/OFF button to toggle the entir
Experience a new approach with amplitude-based momentum analysis. Smart Trend Detection That Adapts to Market Volatility
Draws support and resistance on all pairs.
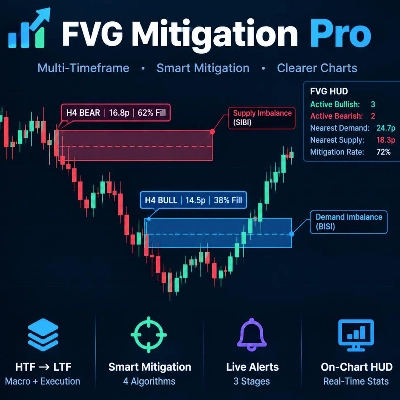
Fair Value Gap scanner with live fill telemetry, 50% CE lines, 4 mitigation rules, and a 3-stage native alert system.
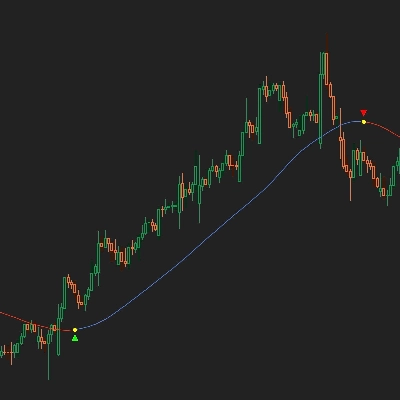
6-stage IIR filter trend indicator with colored line segments, reversal signals, alerts, and entry arrows.
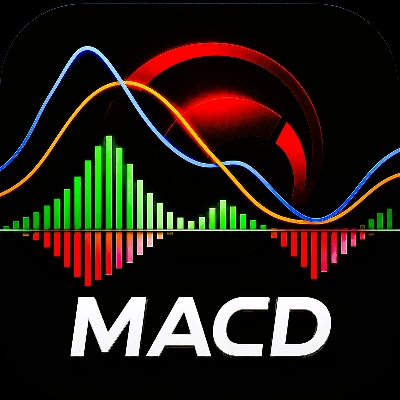
MACD Colour Histogram with 11 Moving Average Types, Multi-timeframe confirmation and Sound Signal Alert.
Add your provider's gamma levels by hand or automatically with our feed plugin, and see the gamma regime at a glance.
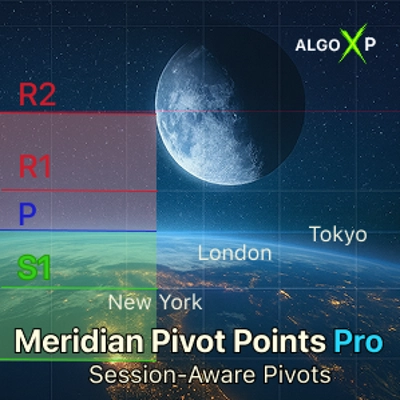
🚀See the market’s framework, decide faster. Session-Aware Pivots. Auto Presets. Pro-Grade Zones.🚀
Anchor volume profiles to pivots with POC, VAH, VAL and real-time insights for clearer trade decisions.
Laser entries with pivot confirmation. No repaint, all timeframes. Professional results.

価格

5.66K
無料インストール