
IR Candle MTF
インジケーター
2.02K ダウンロード数
バージョン 1.0、Jan 2025
Windows、Mac
4.6
レビュー: 6
説明
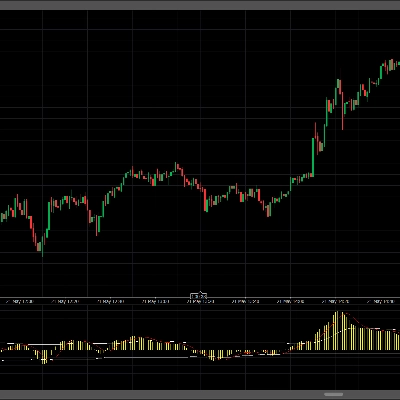
このインジケーターを使うと、チャートで他の時間枠のローソク足を見ることができます。
概要
AIによる概要
IR Candle MTF is a trading indicator that allows users to view candlestick data from different time frames directly on their current chart. This functionality enables traders to analyze multiple time frames simultaneously without switching charts, facilitating a more comprehensive market overview. The indicator integrates seamlessly into existing charts, displaying higher or lower time frame candles overlaid on the active chart timeframe. It supports various time frames as per user needs, enhancing multi-time frame analysis for improved decision-making.
インジケーターのプロフィール
カスタマーレビュー
4.6
レビュー: 6
5 | 67 % | |
4 | 33 % | |
3 | 0 % | |
2 | 0 % | |
1 | 0 % |
カスタマーレビュー
July 9, 2025
Pros: Displays higher timeframe candles on lower charts. Clear visualization, easy setup, useful for multi-timeframe analysis. Cons: No tooltips or OHLC data on candles. Can't save templates. Lacks filtering by candle patterns or integrated alerts.
July 3, 2025
July 3, 2025
or if the thickness of the wick could be increased without emphasizing the outline of the candle.
April 14, 2025
I had tried creating something similar previously but yours is better, I would suggest adding an option to have an outer box act as a candle wick to make it easy on the eyes
ディスカッション
よくあるご質問
cTrader Storeで入手可能な取引ボット、インジケーター、プラグインなどの商品は、第三者の開発者が提供するものであり、情報と技術の取得のみを目的としてご利用いただけます。cTrader Storeはブローカーではなく、投資助言や個人的な推奨を行うことも、将来のパフォーマンスを保証することもありません。


価格
5.15K
無料インストール