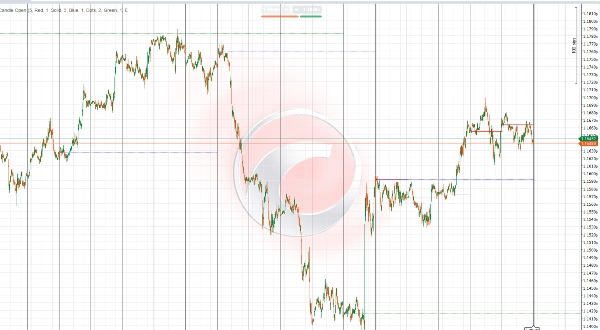
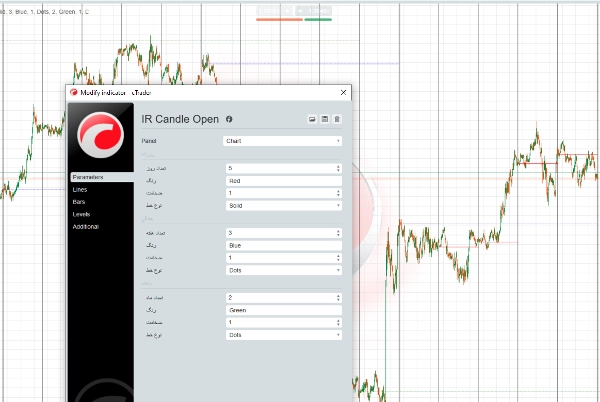
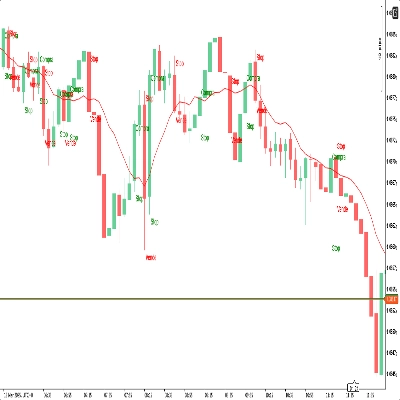
ブローカー&プロップファーム
事業者向け
00
Days
:
00
Hours
:
00
Minutes
:
00
Seconds
IR Candle Open
「IR Candle Open」ロゴ
登録日 23/01/2025
無料インストール
4249
「IR Candle Open」アップロード画像「IR Candle Open」アップロード画像

IR Candle Open Indicator is a versatile and customizable tool that plots the opening prices of weekly, daily, and monthly candles on your trading chart. Traders can select the number of periods (days, weeks, months) to display, enabling flexible multi-timeframe analysis tailored to their strategy.

Key features include:

  • Precise plotting of candle opens for user-defined numbers of daily, weekly, and monthly periods.
  • Customizable line styles: users can choose line type (solid, dashed, dotted), color, and thickness for better chart readability.
  • Supports multi-timeframe visualization to help identify important price levels across different time horizons.
  • Assists in spotting potential support and resistance zones based on these critical opening prices.
  • Compatible with various markets such as Forex, commodities, indices, and cryptocurrencies.

This flexibility empowers traders to adapt the indicator’s display to their personal preferences and trading style, enhancing clarity and improving decision-making based on crucial price levels.


توضیح فارسی (به‌روز شده)

اندیکاتور IR Candle Open ابزاری منعطف و قابل تنظیم است که قیمت‌های باز شدن کندل‌های هفتگی، روزانه و ماهیانه را روی نمودار معاملاتی شما نمایش می‌دهد. کاربران می‌توانند تعداد دوره‌های روزانه، هفتگی و ماهیانه که می‌خواهند خطوط آن‌ها نمایش داده شود را انتخاب کنند تا تحلیل چندتایم‌فریمی متناسب با سبک معاملاتی خود داشته باشند.

ویژگی‌های کلیدی:

  • نمایش دقیق خطوط قیمت باز شدن کندل‌ها برای تعداد دوره‌های دلخواه در تایم‌فریم‌های روزانه، هفتگی و ماهیانه.
  • امکان انتخاب نوع خط (ساده، خط‌چین، نقطه‌چین)، رنگ و ضخامت خطوط برای بهبود وضوح و خوانایی نمودار.
  • پشتیبانی از تحلیل چندتایم‌فریمی جهت شناسایی سطوح مهم قیمتی در بازه‌های زمانی مختلف.
  • کمک به تشخیص سطوح حمایت و مقاومت احتمالی بر اساس این نقاط کلیدی باز شدن قیمت‌ها.
  • مناسب برای استفاده در بازارهای مختلف مانند فارکس، کالاها، شاخص‌ها و رمزارزها.

این قابلیت‌ها به تریدرها امکان می‌دهد تا نمایش اندیکاتور را بر اساس سلیقه و سبک معاملاتی خود تنظیم کنند و با وضوح بیشتر، تصمیمات بهتری بگیرند.

5.0
レビュー: 1
5
100 %
4
0 %
3
0 %
2
0 %
1
0 %
カスタマーレビュー
November 18, 2025
この作成者の他の商品
トップ評価
無料
IR Candle MTF
with this indicator you could see other time frame candle in your chart.
IR Spread
show spread on chart
IR Macd + MacdLine
some user add moving average to macd to see better. in ctrader 4.3.11 there is a problem with this . I make a macd tha
IR Macd on Chart
this indicator show macd on chart.
IR Moving Average
 this moving include everything that a trader needs from Moving Average.
IR Moving MTF
multi time frame moving averge. you could choose different type of price like median ,high and ... and differnt type of
IR Ichimoku Macd
this indicaotr show distance between Tenkan to Kijun, Close to Kijun and Close to Tenkan 
IR Slowing Moving
Add Slowing to IR Moving Average.
IR CheckList
you could put your check list in your chart you could split your test with “,” you could put your checklist in indicat
IR Coral
Coral indicator
IR Multi Data
show symbol and time fram, daily net profit percent, daily net profit, and spread ln your chart. consider that timezone
IR Close MTF
this indicator show other time frame close in lower time frame. for ex: show daily close in m 15.
IR VLine
don't move to the end of chart after timeframe changing. it should be better to use for near history. for long history
IR Open Connector
This indicator connects the opening prices of higher timeframe candles (Daily, Weekly, Monthly, or
これも好きかも
IR Close MTF
this indicator show other time frame close in lower time frame. for ex: show daily close in m 15.
[Stellar Strategies] Wave Trend Pro
Momentum oscillator identifying reversals using dual WaveTrend lines, histogram, and OB/OS levels with optional signals.
Weekly Daily Levels
The Weekly Daily Levels indicator shows the OHLC, and mid-point prices for the previous day and week.
dark-cloud
The Dark Cloud Cover indicator detects a bearish reversal pattern, marking key candles and confirming signals based on v
インジケーター
NAS100
Indices
NZDUSD
+9
Volumatic Fair Value Gaps
📊 Detects Fair Value Gaps with lower timeframe volume analysis & clean dashboard 🟢🔴
インジケーター
NAS100
NZDUSD
XAUUSD
+16
Candles Volume Delta
CANDLES VOLUME DELTA
MultiTimeFrameTrend
A compact, visual multi-timeframe trend indicator for cTrader. Easily spot bullish or bearish trends across 4 customizab
インジケーター
NAS100
NZDUSD
Martingale
+26
ICT Killzones
Complete ICT Killzones: 5 sessions, easy colors, transparency controls & session info. Professional timing for cTrader.
Fx4U.Multi TimeFrame Support & Resistance
Allow trader to visualize Support & Resistance across different timeframes,give trader an overview of the current market
インジケーター
NAS100
Breakout
XAUUSD
+12
SigmaTrend Oscillator
SigmaTrend Oscillator is an advanced momentum-based trend identification tool that combines dynamic price
SwingHighLow
Auto-detect swing highs/lows. Spot reversals, map structure, and filter noise with adjustable strength.
インジケーター
Indices
Forex
Crypto
Super Arrows
Super Arrows
インジケーター
Grid
NAS100
NZDUSD
+17
Order Flow
Volumen Delta", es una representación visual del flujo de órdenes basada en el volumen de transacciones.
インジケーター
RSI
Breakout
XAUUSD
+12
Stop Loss Professional
Stop Loss Pro – Precision Risk Management for Every Trader
インジケーター
Grid
NAS100
NZDUSD
+13
Standard Deviation Channel
Visualize trends with Standard Deviation Channel! Display median, and add customizable upper/lower deviation channels.
Volume Edge Pro
Pro Volume Profile with Delta, Session Filters & CSV Export. Precision order flow analysis.
インジケーター
NAS100
Indices
XAUUSD
+8
Market Sentiment Pro
Market Sentiment Pro: Predict tops & bottoms using crowd psychology. Contrarian signals with 70-80% accuracy. Early Acce
HTF Candles
🌟 HTF indicator for cTrader! Real-time higher timeframe candles (1W-1H) on your chart.