
Automatic Fibonatti
Indicatore
3 acquisti
Versione 1.2, Apr 2026
Windows, Mac
5.0
Recensioni: 2
Descrizione
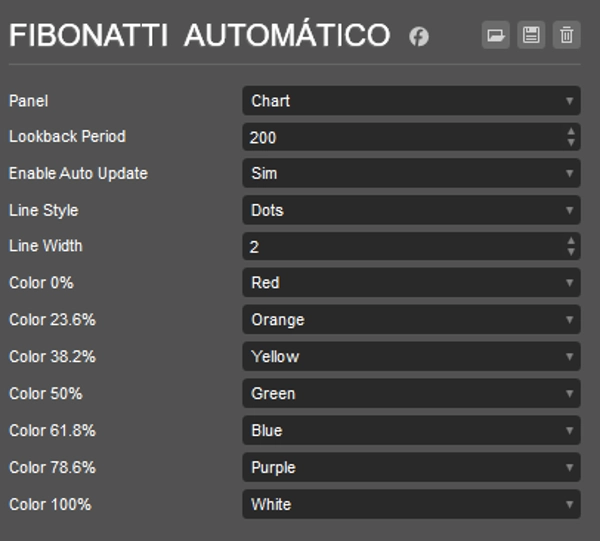
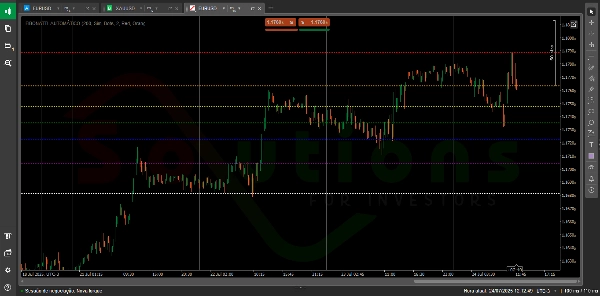
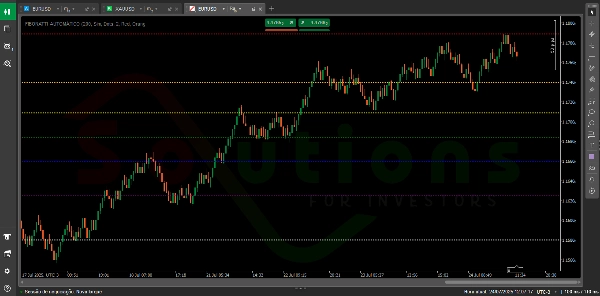
Auto Fibonacci per cTrader
Identifica automaticamente i livelli chiave di prezzo — completamente personalizzabile in base alla tua strategia.
Auto Fibonacci è un indicatore intelligente e flessibile che traccia automaticamente i livelli di ritracciamento di Fibonacci basati sui prezzi più alti e più bassi in un periodo definito dall'utente. Ciò che lo distingue è la sua completa personalizzazione: personalizza il colore, lo stile della linea e lo spessore di ogni livello di Fibonacci per adattarlo alle tue preferenze visive e alla tua strategia di trading. Include anche aggiornamenti in tempo reale, così il tuo grafico riflette sempre l'azione di prezzo più recente — senza bisogno di regolazioni manuali.
Riepilogo
Profilo indicatore
Recensioni dei clienti
5.0
Recensioni: 2
5 | 100 % | |
4 | 0 % | |
3 | 0 % | |
2 | 0 % | |
1 | 0 % |
Recensioni dei clienti
March 7, 2025
The product earns time when it gives the trader a reason to pause. It should not replace the chart.
February 28, 2025
there is less room for random clicking, but manual context is still required.
Discussioni
Domande frequenti
BTCUSD
Forex
Signal
Indices
EURUSD
Commodities
GBPUSD
NZDUSD
Fibonacci
Prop
Scalping
Crypto
Stocks
XAUUSD
NAS100
USDJPY
I prodotti disponibili tramite cTrader Store, inclusi bot di trading, indicatori e plugin, sono forniti da sviluppatori terzi e resi disponibili esclusivamente a scopo informativo e di accesso tecnico. cTrader Store non è un broker e non fornisce consulenze in materia di investimento, raccomandazioni individualizzate o garanzie di risultati futuri.


![Logo di "[Stellar Strategies] MARSI Signal Plotter"](https://cdn.ctrader.com/image/webp/7b2b8da6-8f8e-4646-8d4a-4710c516c01e_25567)

Prezzo
Da 05/02/2025
31
Vendite