
説明
HTFバイアス検出器 — パネル版
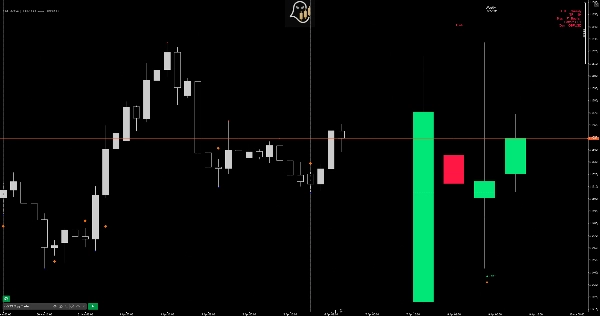
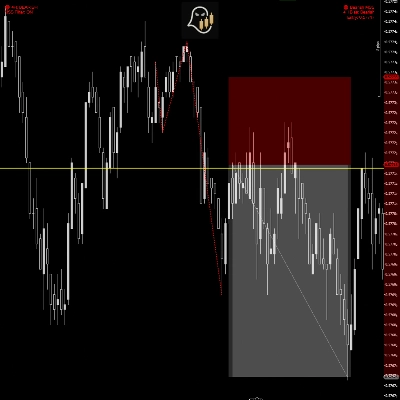
高い時間軸のストーリーを一目で確認。HTFバイアス検出器は、最後のN本の高時間軸ローソク足をチャート上の浮動パネルに直接表示し、時間軸を切り替える必要なく、4つの機関投資家の価格アクションパターンを使って支配的なバイアスを自動的に識別します。
仕組み
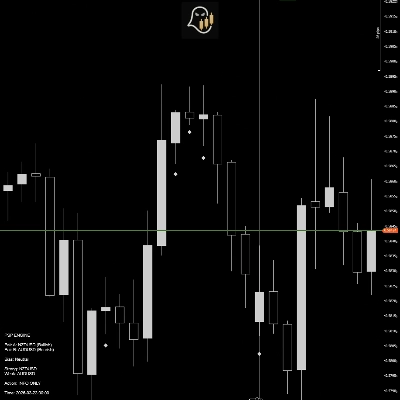
インジケーターは現在のチャート時間軸を自然な高時間軸にマッピングします(例:5分 → 1時間、1時間 → 日足)そして、そのHTFローソク足を価格の右側に固定されたクリーンなパネルに描画します。パターン検出はこれらのローソク足に対してリアルタイムで実行されます。
検出されるパターン
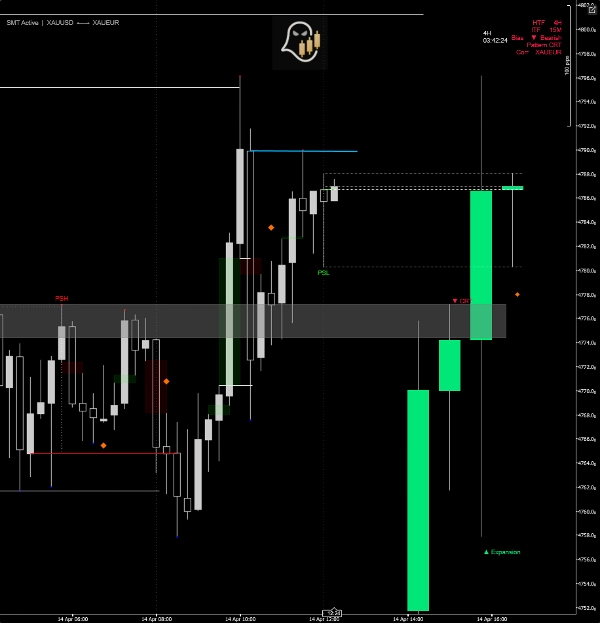
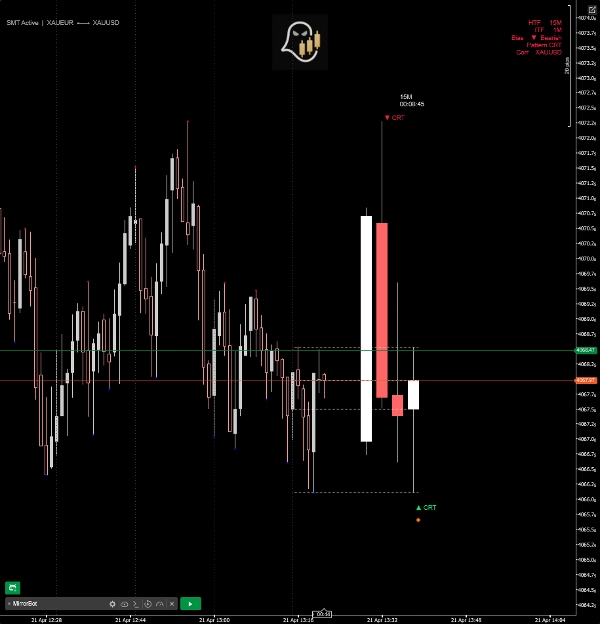
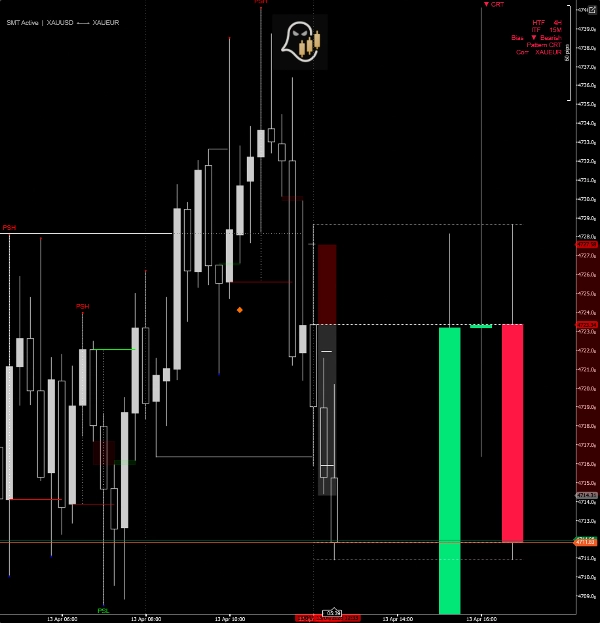
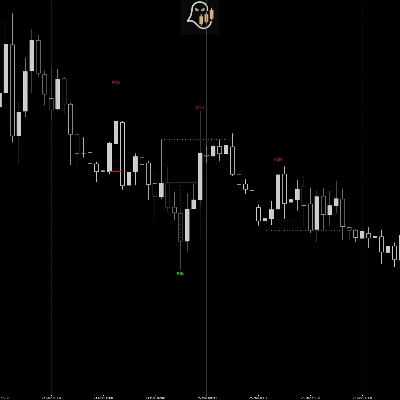
- CRT(キャンドルレンジ理論) — 以前の高値または安値を掃くトラップキャンドルを識別し、内部で終値をつけることで反転の可能性を示します。
- エクスパンション — 前のレンジを完全に包み込み、それを超えて終値をつけるキャンドルを示し、方向性のモメンタムを確認します。
- スイングポイント — 3本のローソク足の連続で、変位キャンドルの後に強い反転が続き、構造的な転換点を示します。
- PSP(精密スイングポイント) — クロスペアのダイバージェンスシグナル。主要シンボルとその相関ペアが同じHTFバーで反対方向のキャンドルを形成すると、PSPダイヤモンドがプロットされます。
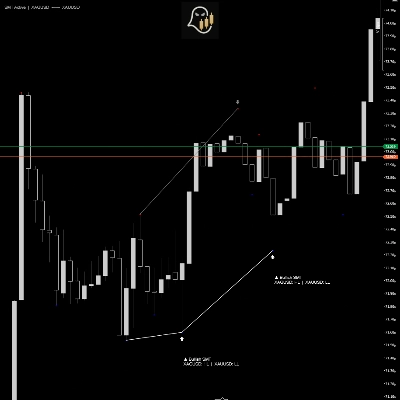
SMTダイバージェンス(HTFパネル)
相関する銘柄間の連続するHTFローソク足ペアを比較します。一方のペアが安値を更新し、もう一方が高値を更新する(またはその逆)場合、SMTダイバージェンスラインがパネル上に方向ラベル付きで描画されます。
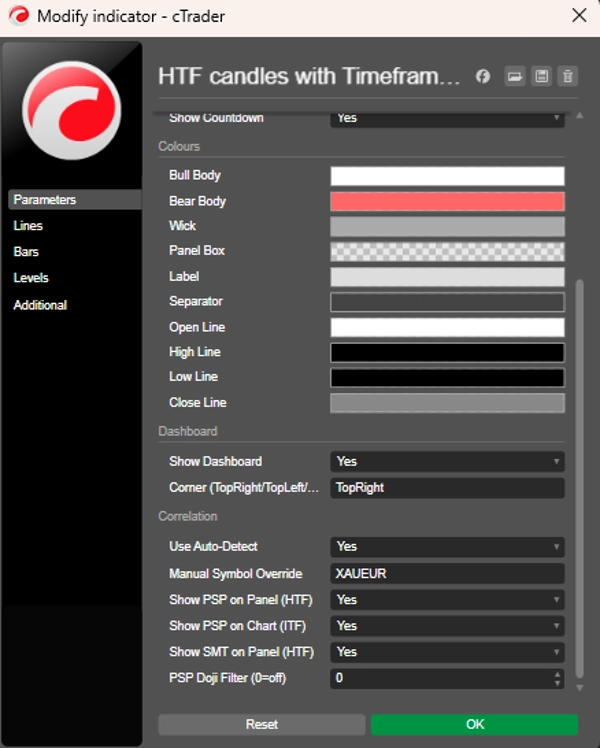
相関ペアの自動検出
チャートシンボルに対して相関する銘柄を自動的に解決します — 主要なFXペア、金属、指数、暗号通貨をカバー。カスタムペアやブローカー固有のシンボル名用に手動オーバーライドも利用可能です。
追加機能
- 次のHTFローソク足のクローズまでのライブカウントダウンタイマー
- 現在形成中のHTFローソク足のOHLC点線リファレンスライン
- HTFオープン時間に合わせたライブチャート上の縦方向セパレーター
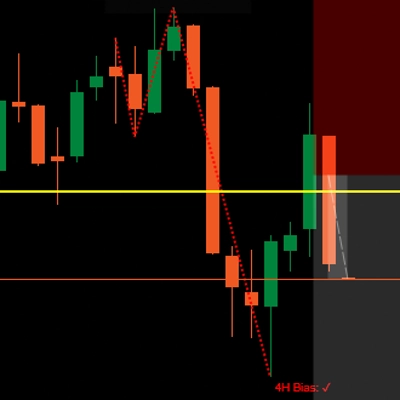
- HTF、ITF、検出されたバイアス、パターン名、相関ペアを表示するコンパクトなダッシュボード
- チャートバー上に直接プロットされるITF PSPダイヤモンド(現在の時間軸)
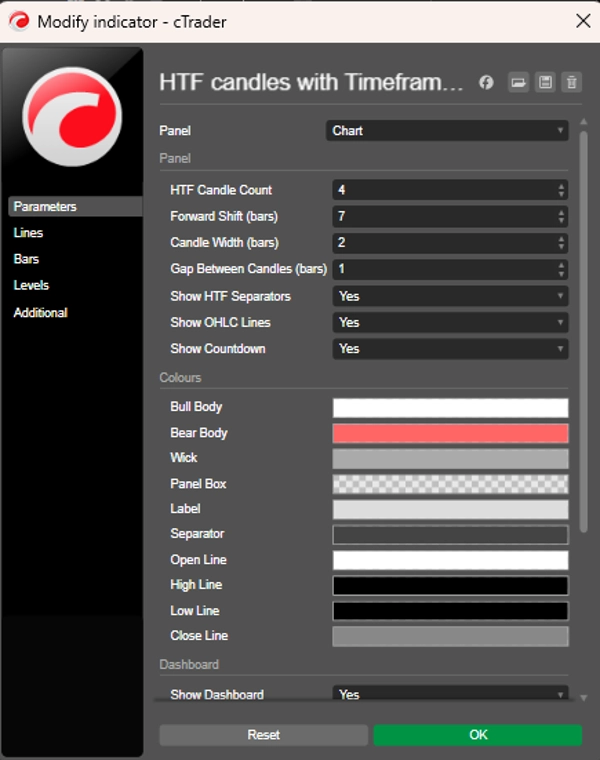
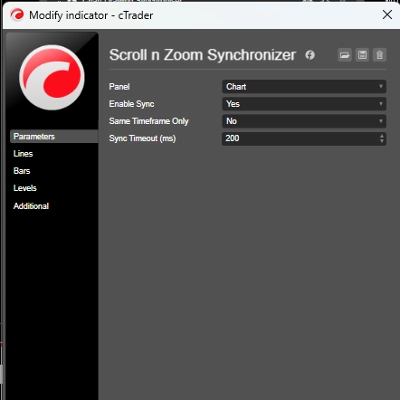
- 完全にカスタマイズ可能な色、パネル幅、ローソク足数、配置
- 弱いPSPシグナルを抑制するためのドージフィルター
時間軸マップ
チャートTF HTFパネル
1分 – 4分 15分
5分 – 10分 1時間
15分 – 30分 4時間
1時間 日足
4時間 週足
日足 月足
概要
AIによる概要
HTF Candles with Timeframe Alignment is a market structure indicator designed to display higher timeframe (HTF) candle data directly on your current chart via a floating panel. It automatically maps the chart’s timeframe to its natural higher timeframe (e.g., 5-minute to 1-hour, 1-hour to daily) and renders the last N HTF candles for quick visual reference without switching timeframes.
The indicator detects four institutional price action patterns in real time on these HTF candles: Candle Range Theory (CRT) trap candles signaling reversals, Expansion candles confirming momentum, Swing Point sequences marking structural turns, and Precision Swing Point (PSP) diamonds indicating cross-pair divergences. It also identifies SMT (Smart Money Technique) divergences between correlated instruments by comparing consecutive HTF candle pairs.
Correlated pairs are auto-detected for major forex pairs, metals, indices, and cryptocurrencies, with manual override options available. Additional features include a live countdown timer to the next HTF candle close, OHLC reference lines, vertical HTF open time separators, a compact dashboard showing HTF and intermediate timeframe bias and patterns, and customizable visual settings. The indicator supports multiple markets including forex, indices, and commodities.
インジケーターのプロフィール
インジケーターのカテゴリー
市場構造(SMC)
出力の種類
ビジュアル表示
シグナル
データ要件
ティックデータ
カスタマーレビュー
4.5
レビュー: 2
5 | 50 % | |
4 | 50 % | |
3 | 0 % | |
2 | 0 % | |
1 | 0 % |
ディスカッション
よくあるご質問
Forex
Indices
Commodities
cTrader Storeで入手可能な取引ボット、インジケーター、プラグインなどの商品は、第三者の開発者が提供するものであり、情報と技術の取得のみを目的としてご利用いただけます。cTrader Storeはブローカーではなく、投資助言や個人的な推奨を行うことも、将来のパフォーマンスを保証することもありません。
この作成者の他の商品
これも好きかも


価格
2
販売