✨ 主な特徴
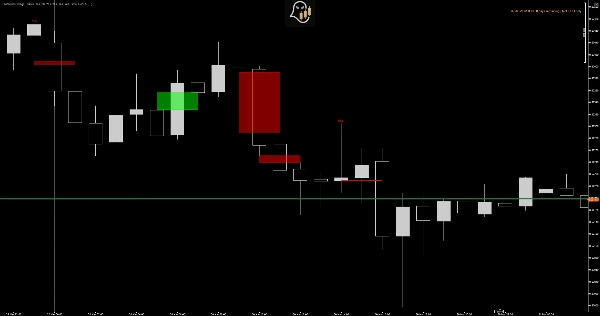
🔍 流動性スイープ検出
- 価格がピボットレベルを超えて流動性を取得する際を自動的に識別
- 本物のブレイクアウトと偽の動き(ストップハント)を区別
- 流動性が取得された正確なゾーンを強調表示
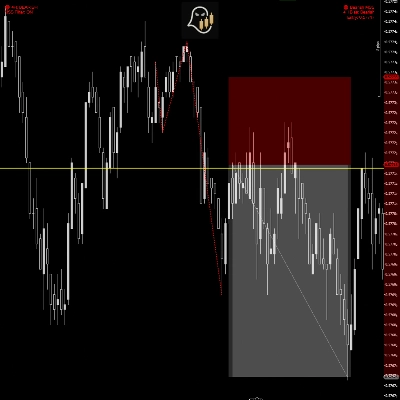
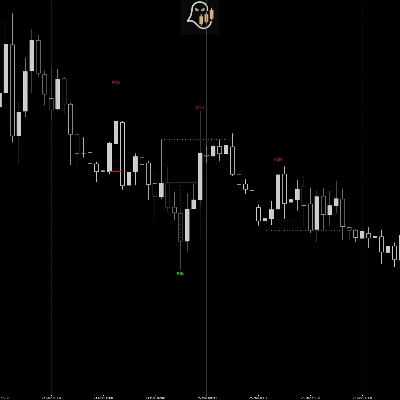
📦 公正価値ギャップ(FVG)分析
- 強気および弱気の公正価値ギャップをリアルタイムで検出
- 複数の時間軸にわたるFVGの緩和を追跡
- アクティブなギャップとその埋まり状況を示すビジュアルボックス
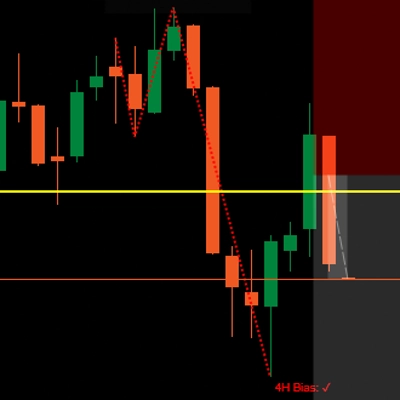
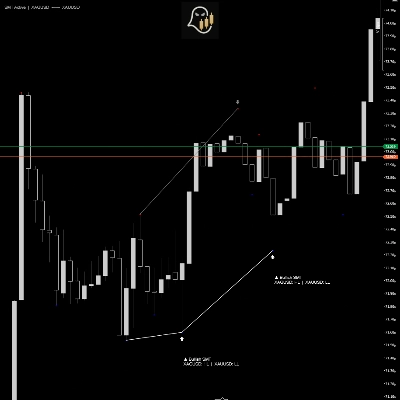
🎯 保護されたスイングの識別
- 保護されたスイングロー(PSL)と保護されたスイングハイ(PSH)をマーク
- スイングが流動性スイープまたはFVG緩和に続く場合のみシグナルを出す
- 重要でないスイングポイントをフィルタリングしてノイズを排除
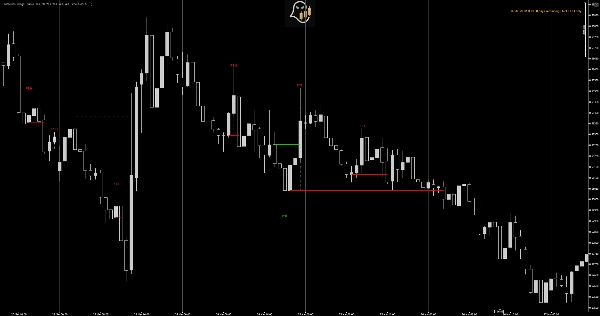
⚡ CISD確認ロジック
- 「配達状態の変化」メソッドを使用
- 価格が重要なレベルの上/下を確認するのを待つ
- ストップがヒットした場合、自動的にセットアップを無効化
🎨 プロフェッショナルなビジュアライゼーション
- クリーンで邪魔にならないチャート表示
- カスタマイズ可能な色と透明度
- 各シグナルの理由を示す詳細なツールチップ
- 簡単な目標設定のための自動レベル拡張
💡 なぜ保護されたスイングなのか?
従来のインジケーターの問題点
ほとんどのスイングインジケーターはすべての高値と安値をマークし、チャートを混雑させ偽のシグナルを生み出します。彼らはランダムな価格変動と本物の機関投資家の活動を区別しません。
保護されたスイングの解決策
スイングをマークする前に流動性スイープまたはFVG緩和のいずれかを要求することで、このインジケーターはスマートマネーが手を見せたセットアップのみを表示します。これによりシグナルの質が劇的に向上し、ホイップソーを減らします。
🚀 仕組み
1. 検出フェーズ
インジケーターは継続的に以下をスキャンします:
- ピボットの高値と安値(感度設定可能)
- 流動性スイープ(ピボットを超えるウィックのみの動き)
- 公正価値ギャップ(価格の非効率性)
2. スイング形成
スイングの安値/高値が形成され、かつ以下のいずれかに続く場合:
- 以前のピボットの流動性スイープ、または
- 価格が公正価値ギャップに入り、インジケーターが「保留中」の保護されたスイングとしてマーク
3. 確認フェーズ(CISD)
スイングは以下の場合にのみ確認されます:
- PSLの場合: スイングローを破らずにレベルの上で終値をつける
- PSHの場合: スイングハイを破らずにレベルの下で終値をつける
4. 無効化
価格が確認前にスイングポイントを破った場合、セットアップは破棄されます。これによりチャートがクリーンに保たれ、有効なセットアップのみに集中できます。
📈 トレーディング応用
トレンド継続エントリー
- 上昇トレンドのPSL = タイトなストップ付きの買い機会
- 下降トレンドのPSH = 定義されたリスクの売り機会
反転トレーディング
- 類似レベルでの複数のPSL = 強い蓄積ゾーン
- 類似レベルでの複数のPSH = 分配/抵抗ゾーン
ストップロスの配置
- ロングポジションのために確認されたPSLのすぐ外にストップを配置
- ショートポジションのために確認されたPSHのすぐ外にストップを配置
- ストップディフェンドメソッドにより最適なリスク配置を保証
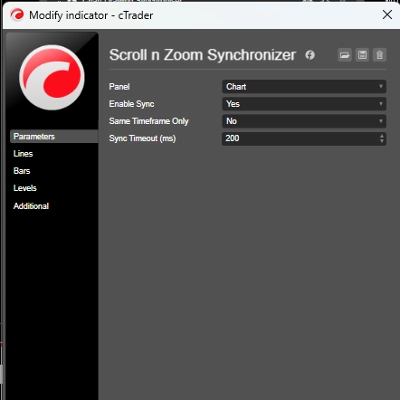
⚙️ カスタマイズ可能なパラメーター
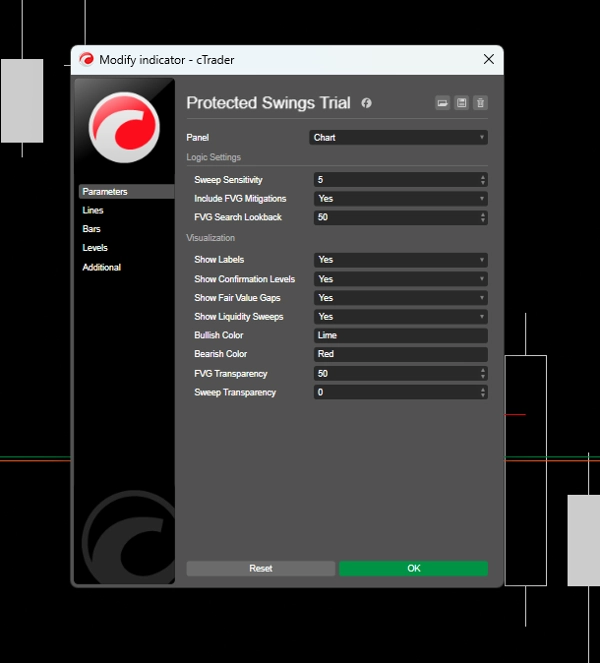
ロジック設定
- スイープ感度 (1-20): ピボットの重要度を制御 - 高いほどシグナルは少なく強力
- FVG緩和を含める: FVGベースのシグナルのオン/オフ切り替え
- FVG検索の遡及期間: FVGをアクティブに保つ期間
### ビジュアライゼーション
- ラベル表示: PSL/PSHマーカーを表示
- 確認レベルの表示: エントリーレベルに水平線を描画
- 公正価値ギャップの表示: FVGボックスを表示
- 流動性スイープの表示: スイープゾーンを強調表示
- カスタムカラー: 強気/弱気要素の完全な色カスタマイズ
- 透明度コントロール:** 視覚的強度を好みに合わせて調整
## ⚠️ トライアル版の制限
これは 7日間トライアル バージョンで、以下の制限があります:
✅ 含まれる内容:
- フルインジケーター機能
- すべての機能がアンロック
- NZDUSDのすべての時間軸に対応
- 完全なパラメーターカスタマイズ
❌ 制限事項:
- シンボル: NZDUSDチャートのみ対応
- 期間: インストールから7日間のトライアル期間
- サポート: トライアル限定のサポート
### 🔓 フルバージョンの利点
- すべての通貨ペア、株式、指数、商品に対応**
- 生涯アクセス - 有効期限なし
- 無料アップデート 生涯対応
- 優先サポート GhostInTheSpreadより
- 詳細なユーザーガイド トレーディング戦略付き
- ビデオチュートリアル とセットアップガイド
5 | 50 % | |
4 | 50 % | |
3 | 0 % | |
2 | 0 % | |
1 | 0 % |