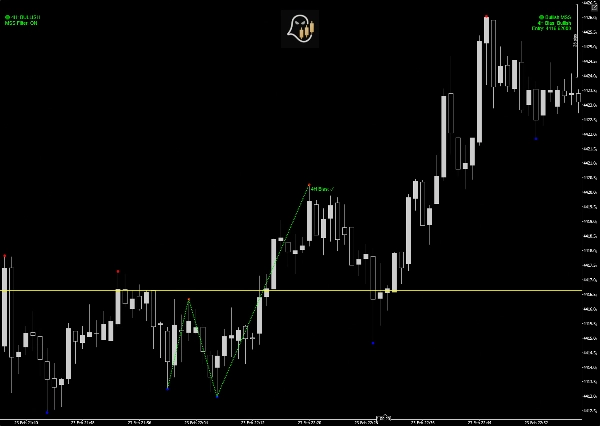
インジケーターはMSS(マーケット構造の変化)パターンを検出します。これらはフラクタルの高値と安値から構成されています。
有効なMSSには以下が必要です:
- 連続した4つのフラクタルスイングポイント
- 前のスイング構造のブレイク
- 反対方向の確認
- 4時間足のバイアスによる任意の確認
検出されると、インジケーターは以下を提供します:
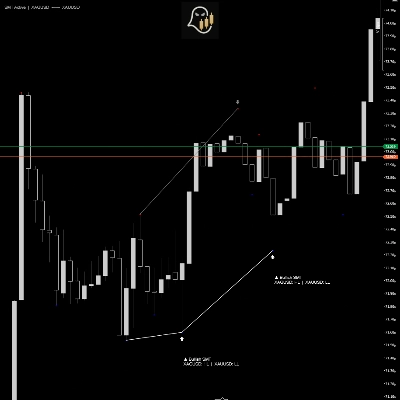
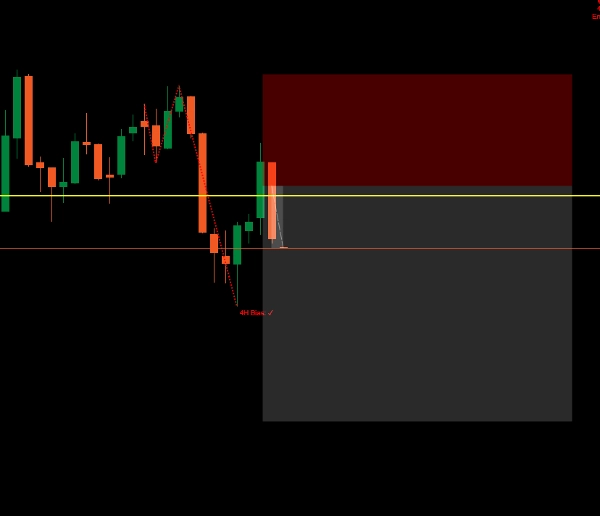
- 視覚的なパターンライン
- フィボナッチのエントリーレベル(50%)
- チャート上のアラートパネル
- 任意のサウンドアラート
- バイアス方向の表示
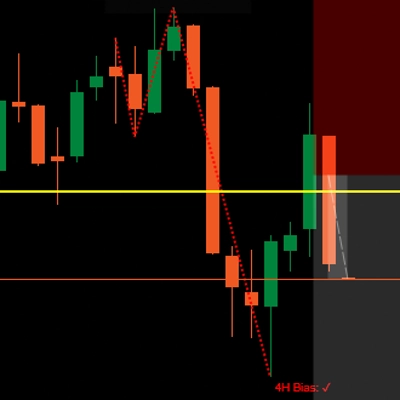
4時間足バイアスフィルター
有効にすると、インジケーターは前の4時間足のローソク足を使ってシグナルをフィルタリングします。
- 強気の4時間足ローソク足 → 強気のMSSのみ表示
- 弱気の4時間足ローソク足 → 弱気のMSSのみ表示
これにより、より高い時間軸のモメンタムに逆らった取引を防ぎます。
バイアスは数分ごとに自動的に更新され、チャートに表示されます。
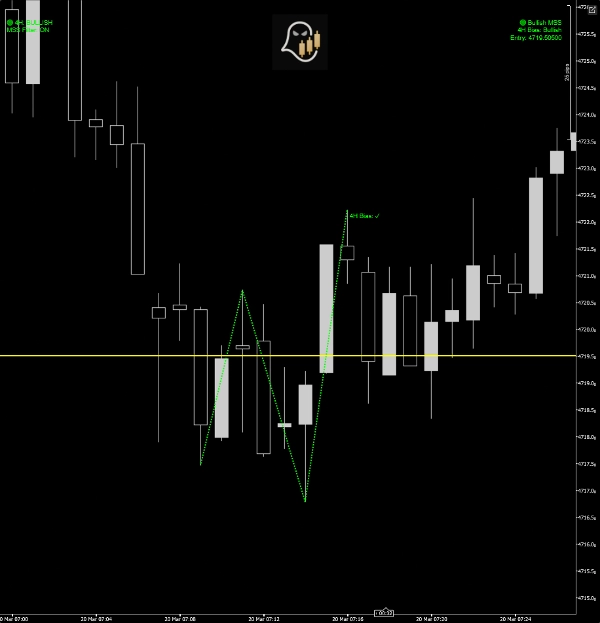
フィボナッチエントリーレベル
MSSを検出した後、インジケーターは以下を計算します:
最後の2つのスイングポイント間の50%のリトレースメント
このレベルは以下を表します:
- 機関投資家の再エントリーゾーン
- 最適なプルバックエリア
- リスク効率の良いエントリープライス
このレベルは水平線として描画されます。
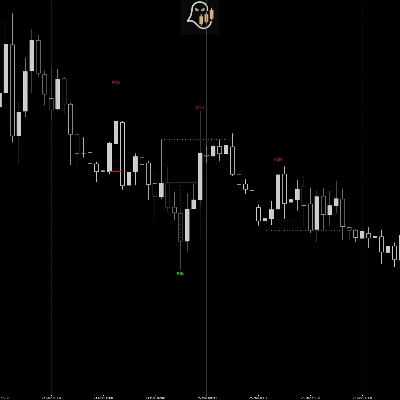
視覚的出力
パターンが形成されると、インジケーターは以下を表示します:
✔ パターンライン
スイングポイントを視覚的に接続
✔ フィボナッチ50%レベル
チャート上でエントリーゾーンを強調表示
✔ バイアス表示パネル
現在の4時間足の方向性バイアスを表示
✔ MSSアラートパネル
アクティブなシグナルとエントリーレベルを表示
✔ サウンドアラート(任意)
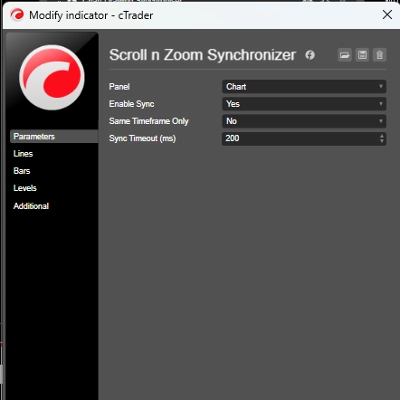
入力パラメーター
フラクタル期間
スイングの感度を制御します。
- 値が低い → シグナルが多くなる
- 値が高い → 強いスイングのみ
4時間足バイアスフィルターを使用
より高い時間軸に基づいてシグナルをフィルタリングします。
推奨: オン
MSSアラートを表示
チャート上にシグナルテキストを表示します。
アラートサウンド
MSSが形成されたときに通知音を再生します。
パターンラインを描画
チャート上に視覚的な構造を表示します。
アラートのみを希望する場合は無効にしてください。
インジケーターを使った取引方法
ステップ1
MSSの検出を待ちます。
ステップ2
バイアスの整合性を確認します。
ステップ3
50%のフィボナッチレベルをマークします。
ステップ4
価格がゾーンにリトレースするのを待ちます。
ステップ5
MSSの方向にエントリーします。
5 | 50 % | |
4 | 50 % | |
3 | 0 % | |
2 | 0 % | |
1 | 0 % |