
Cumulative Volume Delta
インジケーター
4 購入済
バージョン 1.0、Mar 2026
Windows、Mac
4.0
レビュー: 1
説明
クラシック比例CVD(アンカー付き)
市場参加者の真の意図を解き明かす クラシック比例CVD。単にティックボリュームを合計する標準的な累積ボリュームデルタ指標とは異なり、このツールは 比例ロジックを使用して、各バー内の実際の価格変動に基づいてボリュームを重み付けします。
なぜ「比例」デルタなのか?
標準的なCVDは誤解を招くことがあります。この指標は、バーのレンジ(高値-安値)と終値-始値の距離の関係を分析してデルタを計算します。これにより、ボリュームが現実的に分配されることを保証します:
- 強い確信のローソク足(高値/安値付近での終値)がデルタにより多く寄与します。
- ヒゲの長いローソク足(吸収や拒否のサイン)がデルタを中和し、「偽」のボリュームシグナルを防ぎます。
主な特徴
- ⚓ スマートアンカリング(マルチタイムフレームリセット): 現在の取引セッションに分析を関連付けます。計算を 日次、週次、または月次でリセットするか、無期限に継続するかを選択できます。
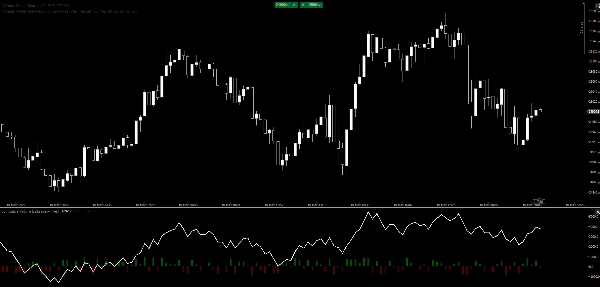
- 📊 デュアルビジュアル:
-
- CVDライン: 長期のダイバージェンスやトレンドの消耗を見つけるためのクリーンで高性能なライン。
- ヒストグラムオーバーレイ: 各バーの買い/売り圧力を即座に視覚的にフィードバックし、一目でクライマックスや吸収を識別。
- ⚡ 超軽量: cTrader向けにネイティブC#で最適化されており、低スペックのマシンや変動の激しい市場でも遅延ゼロを保証。
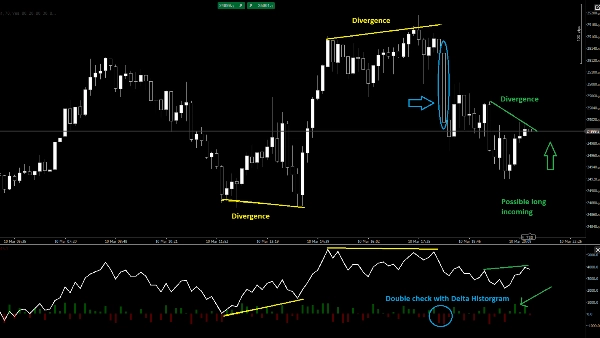
- 🎯 ダイバージェンス検出: 価格が新高値をつけているのにCVDが失敗している場合を簡単に識別でき、これは機関の分配の典型的なサインです。
使い方
- トレンド確認: CVDラインが価格と同じ方向にトレンドしているか確認します。
- 吸収: 価格が新安値をつけたときにCVDヒストグラムが強い「デルタアップ」(緑)を示している場合、買い手が売り圧力を吸収しています。
- 消耗: ヒストグラムの急激なスパイク(クライマックス)とそれに続くCVDラインの反転を注視します。
パラメータ:
- アンカーモード: なし、日次、週次、月次。
- バーのデルタ表示: ヒストグラムのオン/オフ切り替え。
市場参加者の真の意図を解き明かす クラシック比例CVD。単にティックボリュームを合計する標準的な累積ボリュームデルタ指標とは異なり、このツールは 比例ロジックを使用して、各バー内の実際の価格変動に基づいてボリュームを重み付けします。
なぜ「比例」デルタなのか?
標準的なCVDは誤解を招くことがあります。この指標は、バーのレンジ(高値-安値)と終値-始値の距離の関係を分析してデルタを計算します。これにより、ボリュームが現実的に分配されることを保証します:
- 強い確信のローソク足(高値/安値付近での終値)がデルタにより多く寄与します。
- ヒゲの長いローソク足(吸収や拒否のサイン)がデルタを中和し、「偽」のボリュームシグナルを防ぎます。
主な特徴
- ⚓ スマートアンカリング(マルチタイムフレームリセット): 現在の取引セッションに分析を関連付けます。計算を 日次、週次、または月次でリセットするか、無期限に継続するかを選択できます。
- 📊 デュアルビジュアル:
-
- CVDライン: 長期のダイバージェンスやトレンドの消耗を見つけるためのクリーンで高性能なライン。
- ヒストグラムオーバーレイ: 各バーの買い/売り圧力を即座に視覚的にフィードバックし、一目でクライマックスや吸収を識別。
- ⚡ 超軽量: cTrader向けにネイティブC#で最適化されており、低スペックのマシンや変動の激しい市場でも遅延ゼロを保証。
- 🎯 ダイバージェンス検出: 価格が新高値をつけているのにCVDが失敗している場合を簡単に識別でき、これは機関の分配の典型的なサインです。
使い方
- トレンド確認: CVDラインが価格と同じ方向にトレンドしているか確認します。
- 吸収: 価格が新安値をつけたときにCVDヒストグラムが強い「デルタアップ」(緑)を示している場合、買い手が売り圧力を吸収しています。
- 消耗: ヒストグラムの急激なスパイク(クライマックス)とそれに続くCVDラインの反転を注視します。
パラメータ:
- アンカーモード: なし、日次、週次、月次。
- バーのデルタ表示: ヒストグラムのオン/オフ切り替え。
概要
AIによる概要
The Classic Proportional Cumulative Volume Delta (CVD) indicator enhances traditional CVD analysis by applying proportional logic to volume data based on price action within each bar. Instead of simply summing tick volume, it weighs volume according to the relationship between the bar range (high-low) and the close-open distance. This approach assigns greater delta values to strong conviction candles (closing near highs or lows) and neutralizes delta for wick-heavy candles, reducing misleading volume signals.
Key features include smart anchoring with multi-timeframe resets (daily, weekly, monthly, or continuous), dual visuals comprising a CVD line for spotting divergences and trend exhaustion, and a histogram overlay for immediate per-bar buying or selling pressure insights. The indicator is optimized in native C# for cTrader, ensuring high performance and low resource use.
Traders can use the indicator for trend confirmation by aligning CVD direction with price, identify absorption when price lows coincide with strong positive delta in the histogram, and detect exhaustion through histogram spikes followed by CVD reversals. Adjustable parameters include anchor mode and histogram display toggle.
This tool supports analysis across multiple markets and symbols, including Forex, cryptocurrencies, indices, commodities, and stocks.
インジケーターのプロフィール
カスタマーレビュー
4.0
レビュー: 1
5 | 0 % | |
4 | 100 % | |
3 | 0 % | |
2 | 0 % | |
1 | 0 % |
カスタマーレビュー
March 21, 2026
Pretty decent as a backup check, especially in challenge trading. It needs a boring test before bigger size.
ディスカッション
よくあるご質問
BTCUSD
Forex
Signal
Breakout
Indices
EURUSD
Commodities
GBPUSD
NZDUSD
Prop
Scalping
Fair Value Gap
SMC
Crypto
Stocks
XAUUSD
NAS100
USDJPY
VWAP
cTrader Storeで入手可能な取引ボット、インジケーター、プラグインなどの商品は、第三者の開発者が提供するものであり、情報と技術の取得のみを目的としてご利用いただけます。cTrader Storeはブローカーではなく、投資助言や個人的な推奨を行うことも、将来のパフォーマンスを保証することもありません。
この作成者の他の商品


価格
登録日 09/05/2025
5
販売