
الوصف
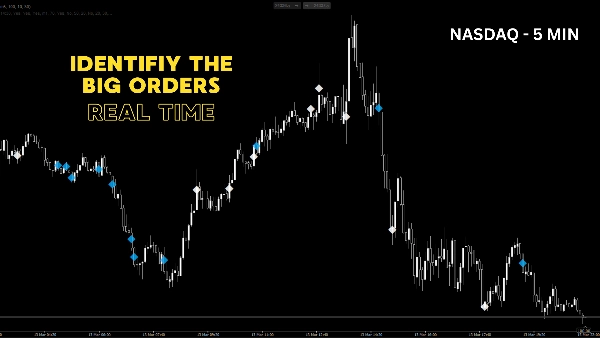
مجموعات الحجم غير الطبيعية هي أداة تحليل حجم عالية الدقة لـ cTrader مصممة للكشف عن آثار المؤسسات والنشاط التداولي الشديد. الحجم يسبق السعر، وهذا المؤشر يوضح لك بالضبط أين "المال الذكي" يدخل السوق.
بدلاً من الاعتماد على حدود حجم ثابتة وساكنة، يستخدم هذا المؤشر منطق النسبة المئوية المتدحرجة الديناميكي. يقوم بتحليل التاريخ الحديث ويبرز فقط الشموع التي يكون حجمها غير طبيعي حقًا (مثل أعلى 5% من أشرطة الحجم الأعلى خلال آخر 200 فترة).
ميزة ضخمة هي القدرة متعددة الأطر الزمنية (MTF): يمكنك التداول على مخطط 5 دقائق بينما يراقب المؤشر بهدوء "الفترة الأساسية" الأعلى (مثل مخطط الساعة) لارتفاعات الحجم، مع عرض تلك المجموعات الحاسمة مباشرة على مخطط الإطار الزمني الأدنى بالضبط حيث حدثت.
🔥 الميزات الرئيسية:
- الحساسية الديناميكية: يستخدم عتبة نسبة مئوية متدحرجة (مثل 95%) بحيث يتكيف تلقائيًا مع ظروف السوق الهادئة والمتقلبة بشدة.
- متعدد الأطر الزمنية الحقيقي: تصفية ضوضاء السوق باستخدام إطار زمني أساسي أعلى، مع الحفاظ على دقة نقاط الدخول في الأطر الزمنية الأدنى.
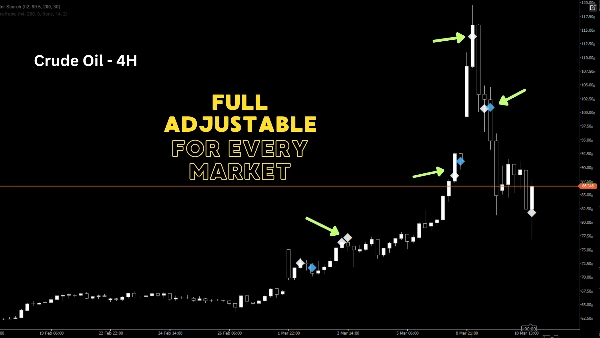
- مجموعات اتجاهية: يتم تمثيل أحداث الحجم الشديدة كعلامات ماسية (◆) عند السعر الوسيط. اللون الأخضر للإغلاقات الصعودية، والأحمر للإغلاقات الهبوطية.
- محسن للغاية: إدارة الذاكرة المدمجة (بحد أقصى 2000 كائن مرسوم) تضمن بقاء منصة cTrader الخاصة بك سريعة للغاية.
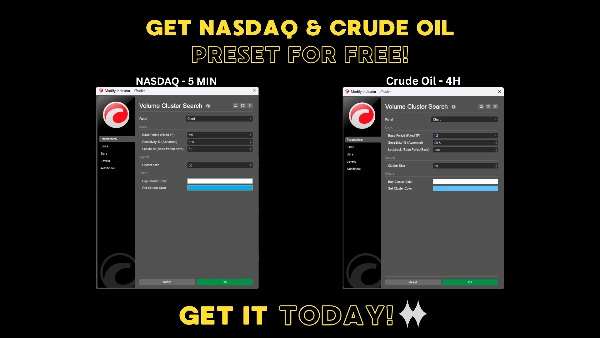
- قابل للتخصيص بالكامل: قم بضبط فترة الاسترجاع، الحساسية (%)، الإطار الزمني الأساسي، حجم المجموعة، والألوان لتناسب أسلوب تداولك الشخصي.
💡 كيف تستخدمه؟
عادةً ما يشير الحجم غير الطبيعي إلى أحد أمرين: بدء اتجاه ضخم (اختراقات) أو استسلام/امتصاص (انعكاسات). من خلال اكتشاف هذه المجموعات، يمكنك تحديد مناطق الدعم والمقاومة المخفية بناءً على رأس المال الفعلي المتداول، وليس فقط حركة السعر. مثالي للمتداولين اليوميين، المتداولين السريع، متداولي التأرجح ومتداولي حركة الحجم الباحثين عن ميزة حقيقية.
الملخص
تقييمات العملاء
5 | 0 % | |
4 | 67 % | |
3 | 33 % | |
2 | 0 % | |
1 | 0 % |


