

説明
製品の完全な説明
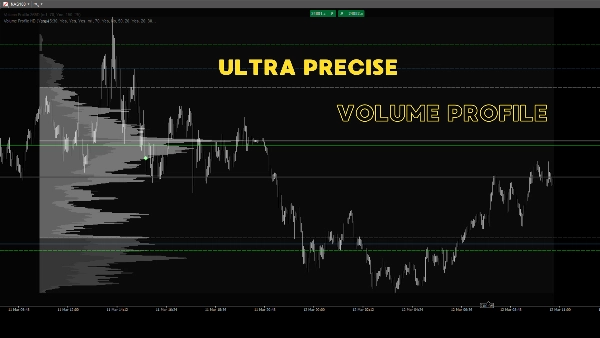
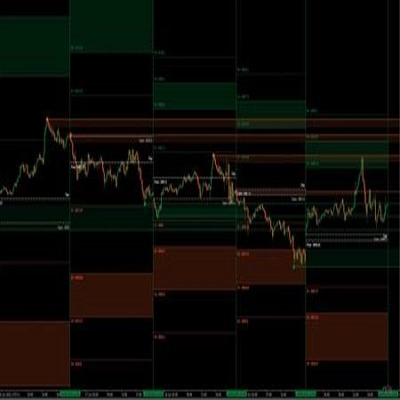
取引を向上させる Rolling Volume Profile MTF、cTrader専用に設計されたプロフェッショナルグレードのインジケーターです。このツールは、チャート上に動的なローリングボリュームプロファイルを直接表示することで、市場構造に関する深い洞察を提供します。
固定された日次プロファイルに依存する代わりに、このインジケーターは 過去24時間、7日間、30日間のボリューム分布を継続的に計算します。これにより、価格変動だけでなく実際の取引量に基づいた真の日中およびスイングのサポート/レジスタンスレベルを特定する上で大きな優位性を得られます。
🔥 主な特徴:
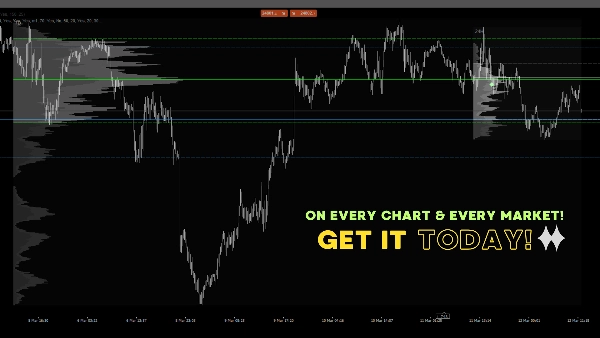
- 3つのローリングプロファイル: 24時間、7日間、30日間のボリューム分布を一つのクリーンなビューで同時に表示します。
- コアボリュームレベル: 各プロファイルのコントロールポイント(POC)、バリューエリアハイ(VAH)、バリューエリアロー(VAL)を自動的に計算しプロットします。
- 拡張バリューライン: POC、VAH、VALのラインを将来に向けて投影し、今後の反応を予測するオプションがあります。
- 正確なNYオープンマーカー: ニューヨークセッションの正確なオープンプライスに独特のマーカー(ダイヤモンド)を自動的にプロットします。初期バランスやセッションベースの戦略に最適です。
- マルチタイムフレームの精度: 1分足などの細かな低時間足データを使用して、任意の高時間足チャート上で非常に正確なプロファイルを構築します。
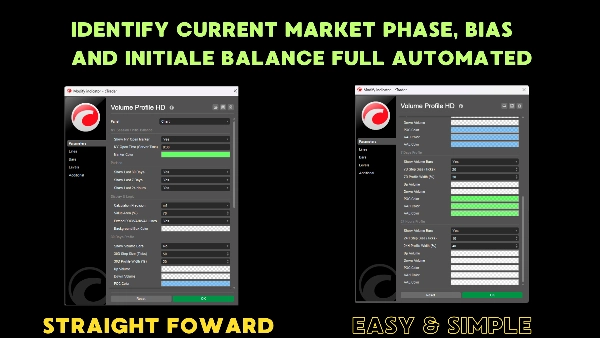
- 完全にカスタマイズ可能: ティックステップサイズ、プロファイル幅、バリューエリアの割合(デフォルト70%)、強気/弱気のボリュームおよび背景ボックスの色を調整できます。
💡 なぜこのインジケーターを使うのか?
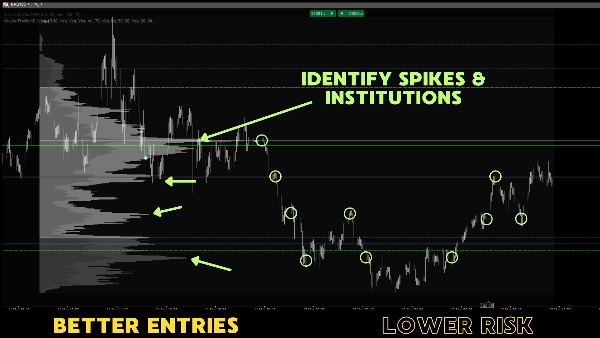
機関投資家は、公正価格と流動性プールを見つけるためにボリュームとバリューエリアに依存しています。特定のローリング期間に最も取引されたボリュームを視覚化することで、高確率のブレイクアウト、反発、反転ゾーンを簡単に見つけることができます。統合されたNYオープンマーカーにより、最も重要な日中の基準価格を見失うことはありません。
デイトレーダー、スキャルパー、先物/外国為替トレーダー、そしてチャート分析で機関投資家の優位性を求めるすべての人に最適です。
概要
AI summary
Volume Profile HD is a multi-timeframe rolling volume profile indicator designed for the cTrader platform. It continuously calculates and displays dynamic volume distributions over the last 24 hours, 7 days, and 30 days, providing traders with detailed insights into market structure based on actual traded volume. The indicator automatically plots key volume levels including the Point of Control (POC), Value Area High (VAH), and Value Area Low (VAL) for each profile, with an option to extend these levels forward to anticipate future price reactions.
A precise New York Session open price marker is included, aiding session-based and initial balance strategies. The indicator builds highly accurate profiles by utilizing granular lower-timeframe data, such as 1-minute bars, on any higher timeframe chart. Customization options allow adjustment of tick step sizes, profile widths, value area percentages, and color schemes for bullish and bearish volumes and background boxes.
This tool is suitable for day traders, scalpers, futures, and forex traders seeking to identify institutional volume levels, support and resistance zones, and high-probability breakout or reversal areas. Supported markets include indices and symbols like NAS100 and XAUUSD.
A precise New York Session open price marker is included, aiding session-based and initial balance strategies. The indicator builds highly accurate profiles by utilizing granular lower-timeframe data, such as 1-minute bars, on any higher timeframe chart. Customization options allow adjustment of tick step sizes, profile widths, value area percentages, and color schemes for bullish and bearish volumes and background boxes.
This tool is suitable for day traders, scalpers, futures, and forex traders seeking to identify institutional volume levels, support and resistance zones, and high-probability breakout or reversal areas. Supported markets include indices and symbols like NAS100 and XAUUSD.
インジケーターのプロフィール
カスタマーレビュー
4.0
レビュー: 3
5 | 0 % | |
4 | 100 % | |
3 | 0 % | |
2 | 0 % | |
1 | 0 % |
カスタマーレビュー
March 23, 2026
fits a trader who wants less noise in the process. The best use is checking participation and pressure, then leaving the final filter manual.
March 21, 2026
Tbh the value is mostly in filtering bad ideas. I still would not trust it live without checking the chart myself. A cautious first pass gives a cleaner opinion.
March 14, 2026
For volume based context, the practical question is whether it reduces bad decisions. A 62 setup journal on New York open makes that clearer.
ディスカッション
よくあるご質問
Breakout
Scalping
Indices
Fair Value Gap
SMC
XAUUSD
NAS100
cTrader Storeで入手可能な取引ボット、インジケーター、プラグインなどの商品は、第三者の開発者が提供するものであり、情報と技術の取得のみを目的としてご利用いただけます。cTrader Storeはブローカーではなく、投資助言や個人的な推奨を行うことも、将来のパフォーマンスを保証することもありません。
この作成者の他の商品



















価格

登録日 09/05/2025
8
販売