

Smart Money Map - JR
Wskaźnik
1 zakupy
Wersja 2.0, May 2026
Windows, Mac
4.0
Opinie: 2

Od 11/02/2026
18
Sprzedaż
372
Bezpłatne instalacje
Opis
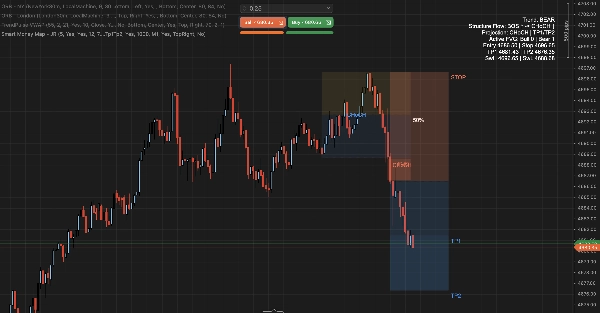
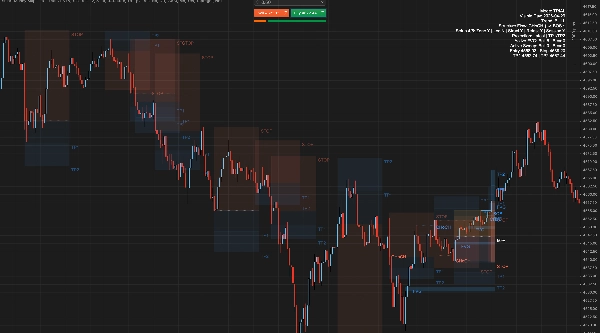
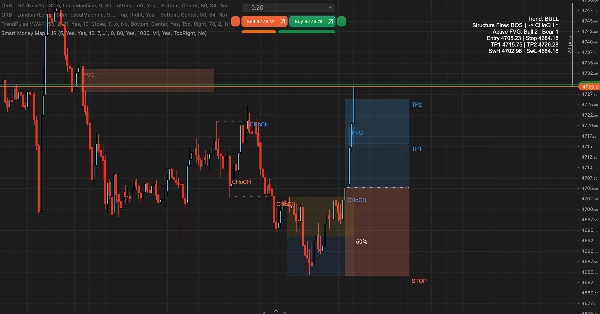
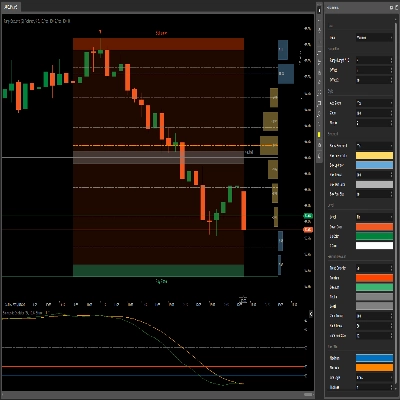
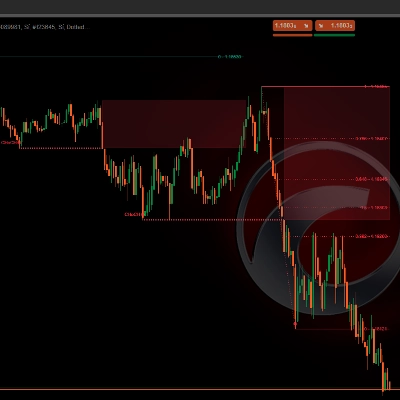
Zaawansowany wskaźnik nakładki do podkreślania kluczowego kontekstu wykonania i pomagania w wyrównaniu struktury, lokalizacji oraz ryzyka w jednym usprawnionym przepływie pracy.
➤ Kluczowe funkcje
- Etykietowanie zdarzeń strukturalnych z konfigurowalną czułością i trybem potwierdzenia
- Aktywne mapowanie luk wartości godziwej z konfigurowalnym rozmiarem i filtrowaniem sesji
- Wykrywanie zmiatania płynności dla wczesnego kontekstu (tylko wynik, tryb minimalny)
- Zakres transakcji premium/discount z równowagą 50%
- Dynamiczne pole projekcji wejścia/stopu/celu
- Elastyczna wizualizacja celu: pojedynczy cel, podział TP1/TP2 lub cele pochodzące ze struktury
- Opcjonalna widoczność etykiety projekcji i maksymalny limit stopu dla ścisłej kontroli intraday
- Kanały wyjściowe gotowe do automatyzacji dla przepływów pracy cBot
- Elastyczne umiejscowienie panelu kontrolnego dla wykresów z wieloma wskaźnikami
- Presety gęstości z opcjonalną automatyczną regulacją ram czasowych
➤ Jak to działa
- Potwierdza strukturalne huśtawki i śledzi zmiany kierunku oraz stany kontynuacji.
- Wykrywa zmiatanie płynności poza chronionymi poziomami huśtawek.
- Mapuje aktywne strefy nierównowagi i aktualizuje je w miarę interakcji ceny ze strukturą.
- Określa aktualną lokalizację rynku w kontekście premium/discount.
- Projekcja mapy ryzyka na podstawie aktualnego stanu struktury.
- Publikuje deterministyczne wyjścia zdarzeń do automatyzacji.
➤ Najlepsze dla
- Planowanie wykresów i wykonania SMC intraday
- Traderów, którzy chcą wizualnej struktury i kontekstu POI bez nadmiernego zagracenia
- Konfiguracje z wieloma wskaźnikami, które potrzebują konfigurowalnego umiejscowienia panelu kontrolnego
➤ Jak używać
- Najpierw odczytaj strukturę za pomocą wskaźnika trendu na panelu kontrolnym.
- Użyj kontekstu lokalizacji, aby zidentyfikować strefy premium i discount.
- Użyj aktywnych stref nierównowagi i opcjonalnego kontekstu zmiatania, aby dopracować timing.
- Użyj mapy projekcji jako odniesienia do planowania transakcji.
➤ Dołączone kontrolki
- Czułość struktury i tryb potwierdzenia
- Rozmiar nierównowagi, filtrowanie sesji i zachowanie wyświetlania łagodzenia
- Opcje zakresu transakcji i wyświetlania projekcji
- Kontrolki projekcji, w tym tryb celu, tryb kotwicy, widoczność etykiety i opcjonalny limit stopu
- Tryby gęstości: Niestandardowy, M1, M5, M15, H1, H4, D1
- Opcjonalna automatyczna regulacja gęstości w zależności od ram czasowych wykresu
- Personalizacja kolorów dla czytelności wykresu
Podsumowanie
Podsumowanie AI
Smart Money Map - JR is an advanced overlay indicator designed for intraday trading to visually highlight key market execution contexts by integrating structure, location, and risk into a streamlined workflow. It identifies and labels structural events with configurable sensitivity and confirmation modes, detects liquidity sweeps beyond swing levels, and maps active fair value gaps with adjustable sizing and session filters. The indicator frames market price zones into premium and discount ranges centered around a 50% equilibrium level.
It features dynamic projection boxes for entry, stop, and target levels, supporting flexible target visualization options including single targets, split take-profits, or structure-derived targets. Users can control projection label visibility and apply maximum stop caps for tighter intraday risk management. The tool supports automation through deterministic event outputs compatible with cBot workflows and allows customizable dashboard placement for multi-indicator chart setups. Density presets with optional automatic timeframe adjustment enhance adaptability across different chart resolutions.
The indicator operates by confirming structural swings, tracking directional shifts, detecting liquidity sweeps, updating imbalance zones as price interacts with structure, and projecting a risk map based on current market conditions. It is suited for traders seeking clear visual structure and points of interest without chart clutter, particularly those focused on Smart Money Concepts (SMC) and market structure analysis.
Profil wskaźnika
Kategoria wskaźnika
Struktura rynku (SMC)
Typ wyjścia
Wizualizacja
Wymagania dotyczące danych
Tylko słupki
Obsługiwane sygnały
Siła trendu
Przebicie poziomu
Dotknięcie poziomu
Dyskusja
Opinie klientów
4.0
Opinie: 2
5 | 0 % | |
4 | 100 % | |
3 | 0 % | |
2 | 0 % | |
1 | 0 % |
Częste pytania
Premium/Discount
MSS
BOS
CHOCH
Market Structure
Produkty dostępne za pośrednictwem cTrader Store, w tym boty handlowe, wskaźniki i wtyczki, dostarczane są przez deweloperów zewnętrznych i udostępniane wyłącznie w celach informacyjnych oraz w celu zapewnienia dostępu technicznego. cTrader Store nie jest brokerem i nie zapewnia doradztwa inwestycyjnego, nie udziela spersonalizowanych rekomendacji ani nie gwarantuje przyszłych wyników.







Cena
Od 11/02/2026
18
Sprzedaż
372
Bezpłatne instalacje