
Descripción
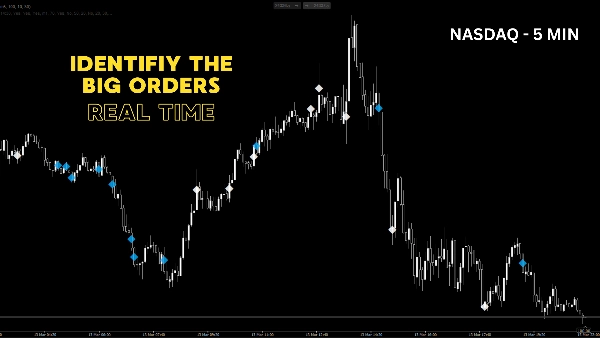
Clusters de Volumen Anormales es una herramienta de análisis de volumen de alta precisión para cTrader diseñada para descubrir huellas institucionales y actividad comercial extrema. El volumen precede al precio, y este indicador te muestra exactamente dónde está entrando el "dinero inteligente" en el mercado.
En lugar de depender de umbrales de volumen fijos y estáticos, este indicador utiliza una lógica dinámica de percentiles móviles. Analiza la historia reciente y solo resalta las velas cuyo volumen es realmente anormal (por ejemplo, el 5% superior de barras de volumen más alto en los últimos 200 períodos).
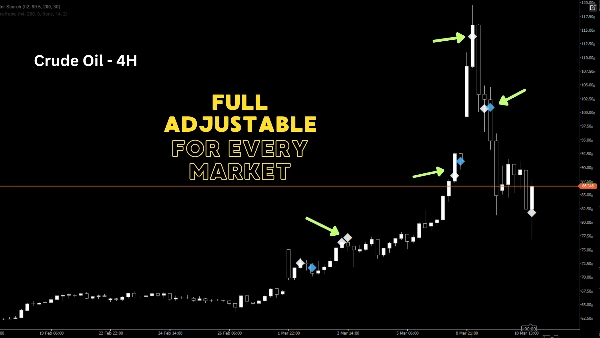
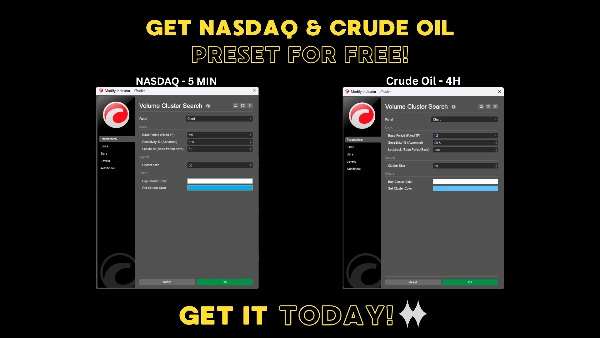
Una gran ventaja es su capacidad Multi-Timeframe (MTF): Puedes operar en un gráfico de 5 minutos mientras el indicador monitorea silenciosamente un "Período Base" superior (como el gráfico de 1 hora) para picos de volumen, proyectando esos clusters cruciales directamente en tu gráfico de marco temporal inferior exactamente donde ocurrieron.
🔥 Características Clave:
- Sensibilidad Dinámica: Utiliza un umbral de percentil móvil (por ejemplo, 95%) para que se adapte automáticamente tanto a condiciones de mercado tranquilas como altamente volátiles.
- Verdadero Multi-Timeframe: Filtra el ruido del mercado usando un marco temporal base superior, mientras mantienes tus entradas con precisión milimétrica en marcos temporales inferiores.
- Clusters Direccionales: Los eventos de volumen extremo se representan como marcadores de diamante (◆) justo en el precio medio. Verde para cierres alcistas, Rojo para cierres bajistas.
- Altamente Optimizado: La gestión de memoria incorporada (máximo 2000 objetos dibujados) asegura que tu plataforma cTrader siga siendo extremadamente rápida.
- Totalmente Personalizable: Ajusta el período de retroceso, la sensibilidad (%), el marco temporal base, el tamaño del cluster y los colores para adaptarlos a tu estilo personal de trading.
💡 ¿Cómo usarlo?
El volumen anormal generalmente indica una de dos cosas: inicio masivo de tendencia (rupturas) o capitulación/absorción (reversiones). Al detectar estos clusters, puedes identificar zonas ocultas de soporte y resistencia basadas en el capital realmente negociado, no solo en la acción del precio. Perfecto para Day Traders, Scalpers, Swing Traders y Traders de Acción de Volumen que buscan una ventaja real.
Resumen
Valoraciones de clientes
5 | 0 % | |
4 | 67 % | |
3 | 33 % | |
2 | 0 % | |
1 | 0 % |


![Logotipo de "Gaussian Channel [Iridio Capital]"](https://cdn.ctrader.com/image/webp/7c039209-5573-4a54-a072-f9528b503103_41960)


