
Descripción
Los indicadores de soporte y resistencia en múltiples marcos temporales generalmente permiten a los traders visualizar estos niveles en diferentes marcos temporales, como gráficos horarios, diarios, semanales o mensuales. Al incorporar múltiples marcos temporales, los traders pueden obtener una perspectiva más amplia sobre dónde se encuentran los niveles clave de precio y cómo pueden influir en la acción del precio.
Este tipo de indicador puede ayudar a los traders a tomar decisiones de trading más informadas al identificar niveles significativos de soporte y resistencia que pueden afectar los movimientos de precio en varios marcos temporales. También puede ayudar a los traders a anticipar posibles reversiones u oportunidades de ruptura cuando el precio se acerca a estos niveles en múltiples marcos temporales.
Existen tres tipos de niveles de soporte y resistencia:
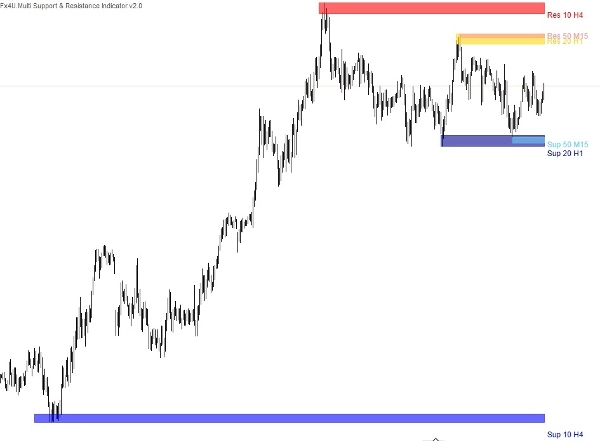
Los tres indicadores de soporte y resistencia están integrados en este único indicador que le permite trazar sus zonas de oferta y demanda en el gráfico con las siguientes configuraciones.
- Valor del período.
- Marco temporal.
- El número de extremos – Este es el número de puntos actuales + pasados de Soporte/Resistencia mostrados. Por ejemplo, si elegimos 2, el indicador seleccionará otro punto de Soporte y Resistencia en el pasado.
- Nombre y color del indicador.
Los niveles de soporte y resistencia que son significativos en marcos temporales más altos tienden a tener más peso y, al usar un indicador de múltiples marcos temporales, los traders pueden confirmar la importancia de un nivel si aparece consistentemente en varios marcos temporales. Esta confirmación aumenta la fiabilidad del nivel y mejora la confianza de los traders en sus decisiones de trading.
Mis otros productos:
https://ctrader.com/products/346
https://ctrader.com/products/336
https://ctrader.com/products/343
https://ctrader.com/products/347
https://ctrader.com/products/147
Resumen
The indicator consolidates three types of support and resistance levels into a single tool, allowing users to plot supply and demand zones with customizable settings such as period value, timeframe, the number of extremum points (current plus past support/resistance points), and indicator name and color. This multi-timeframe approach helps traders identify levels that carry more weight when confirmed across different timeframes, enhancing the reliability of these levels for decision-making.
By visualizing these critical zones, the indicator aids in anticipating potential price reversals or breakout opportunities. It supports a broader market overview, enabling more informed trading strategies based on the interaction of price with established support and resistance across various time horizons.
Valoraciones de clientes
5 | 33 % | |
4 | 67 % | |
3 | 0 % | |
2 | 0 % | |
1 | 0 % |
![Logotipo de "[Fx4U] GBPUSD - Price Action"](https://cdn.ctrader.com/image/webp/d80b34fc-da3c-4f01-a321-456450665649_26190)

![Logotipo de "[Fx4U] CADJPY - Price Action"](https://cdn.ctrader.com/image/webp/1ba81247-b6b7-4f3c-a297-fa3eb1d57fe1_26195)

![Logotipo de "[Fx4U] AUDCHF - Price Action"](https://cdn.ctrader.com/image/webp/0a22e9aa-c83b-42cd-b0b8-c1a2da593207_26148)

![Logotipo de "[Fx4U] EURAUD - Price Action"](https://cdn.ctrader.com/image/webp/baf8dde4-1ef3-4beb-8ae2-0fed8320f65d_26177)


