
Higher TimeFrame Candle Tracker
Indikator
1 käufe
Version 1.0, Oct 2025
Windows, Mac
Beschreibung
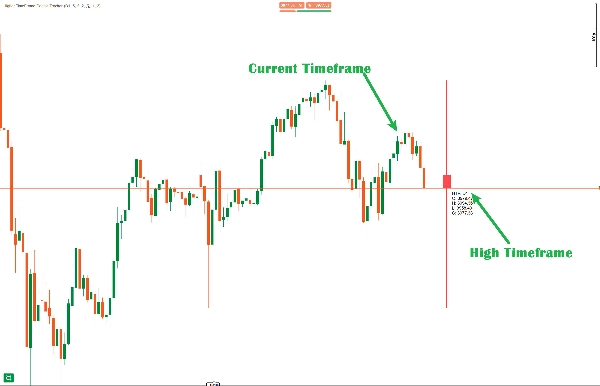
Der Kerzen-Tracker für höhere Zeitrahmen wird verwendet, um einen Einblick zu erhalten, wie die ausgewählte Kerze des höheren Zeitrahmens aussieht.
Hauptmerkmale:
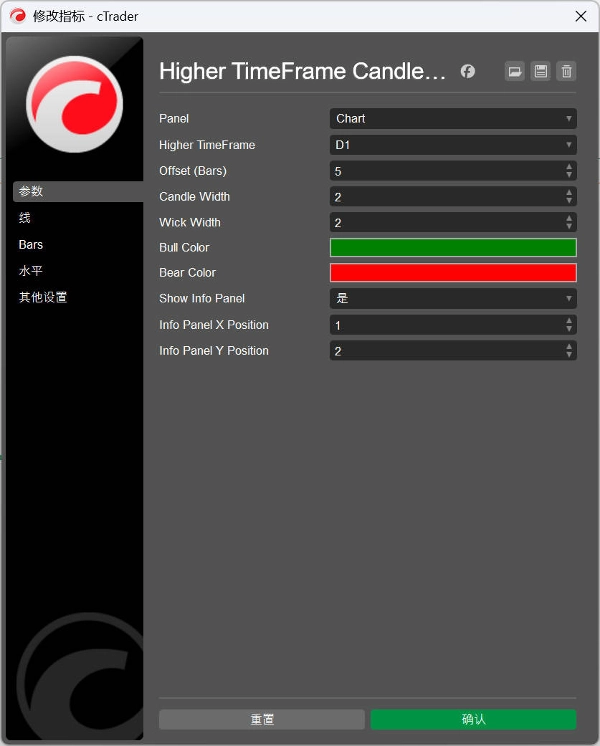
- Anpassbare Zeitauswahl - Wählen Sie jeden höheren Zeitrahmen (Täglich, Wöchentlich, Monatlich usw.)
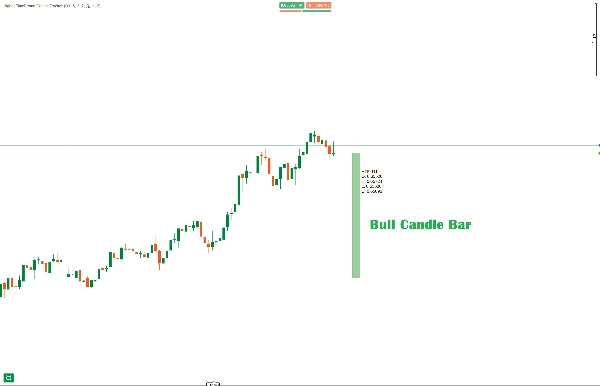
- Visuelle Kerzendarstellung - Die aktuelle HTF-Kerze wird mit korrekten Dochten und Körper dargestellt, versetzt von der aktuellen Kursbewegung
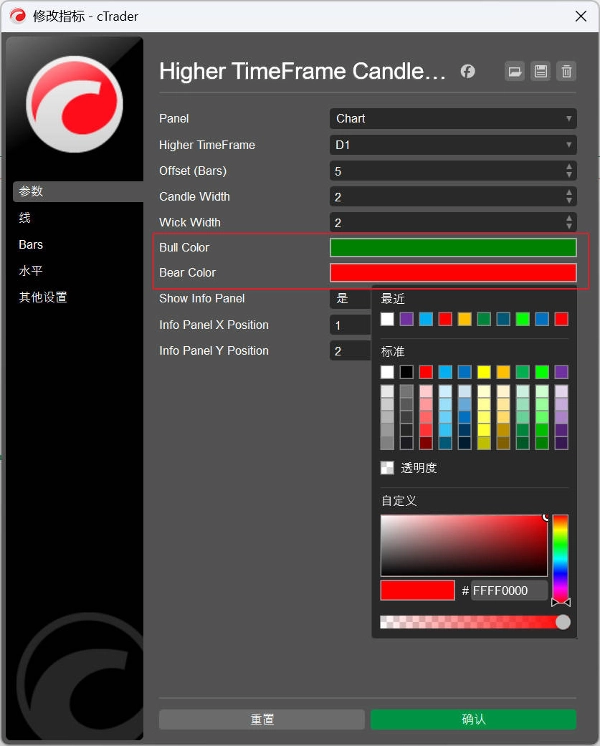
Einstellbare Optionen:
- Versatz: Abstand in Kerzen von aktuellem Kurs (Standard: 5)
- Kerzenbreite: Dicke des Kerzenkörpers (1-10, Standard: 3)
- Dochtbreite: Dicke der Dochtlinien (1-5, Standard: 1)
- Farben: Anpassbare Bullen- (grün) und Bärenfarben (rot)
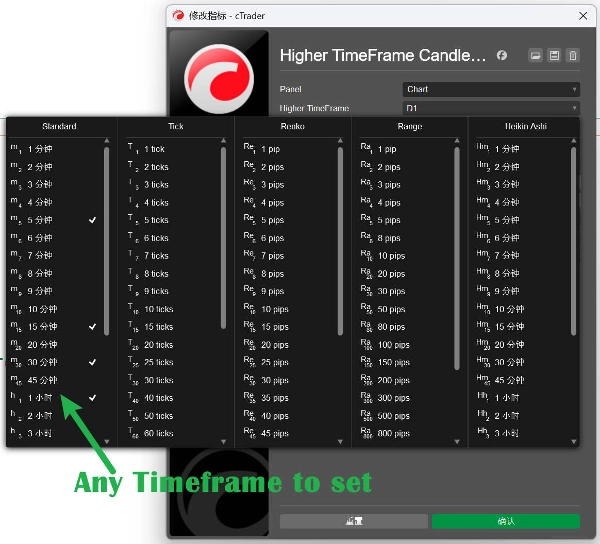
Unterstützte Zeitrahmen:
- Minute, Minute2, Minute3, Minute4, Minute5
- Minute10, Minute15, Minute30, Minute45
- Stunde, Stunde4, Stunde12
- Täglich, Tag2, Tag3
- Wöchentlich, Monatlich
Informationstabelle - Zeigt Echtzeitdaten der HTF-Kerze: Open, High, Low, Close Werte.
中文说明:
可自定义参数:
- Higher TimeFrame(高时间框架) - 选择要跟踪的时间框架(默认:Daily)
- Offset(偏移量) - K线距离当前价格的位置(默认:5根K线)
- Candle Width(K线宽度) - K线实体的宽度(1-10,默认:3)
- Wick Width(影线宽度) - 影线的宽度(1-5,默认:2)
- Bull Color(看涨颜色) - 看涨K线颜色(默认:Green)
- Bear Color(看跌颜色) - 看跌K线颜色(默认:Red)
- Show Info Panel(显示信息面板) - 是否显示HTF数据面板(默认:true)
核心特性:
- 实时HTF K线显示 - 在图表上绘制当前高时间框架K线
- 完整的K线结构 - 包含实体、上影线和下影线
- 颜色区分 - 自动根据涨跌使用不同颜色
- 信息面板 - 显示Open、High、Low、Close和方向指示
- 自适应填充 - 看涨K线半透明,看跌K线较深
支持的时间框架:
- Minute, Minute2, Minute3, Minute4, Minute5
- Minute10, Minute15, Minute30, Minute45
- Hour, Hour4, Hour12
- Daily, Day2, Day3
- Weekly, Monthly
Zusammenfassung
Indikatorprofil
Kundenbewertungen
0.0
Bewertungen: 0
Kundenbewertungen
Bisher gibt es keine Bewertungen für dieses Produkt. Haben Sie es schon ausprobiert? Dann können Sie die erste Person sein, die andere darüber informiert!
Diskussion
Häufig gestellte Fragen (FAQ)
Prop
Forex
Breakout
Indices
Commodities
Crypto
Stocks
Über den cTrader Store verfügbare Produkte, einschließlich Handelsbots, Indikatoren und Plugins, werden von externen Entwicklern bereitgestellt und nur zu Informations- und technischen Zugriffszwecken verfügbar gemacht. cTrader Store ist kein Broker und erbringt keine Anlageberatung, persönlichen Empfehlungen oder eine Garantie für zukünftige Performance.


![„[Stellar Strategies] MARSI Signal Plotter“-Logo](https://cdn.ctrader.com/image/webp/7b2b8da6-8f8e-4646-8d4a-4710c516c01e_25567)


Preis
Seit 30/09/2024
44
Verkäufe