
New Way Sar - Pro
مؤشر
3 عمليات الشراء
الإصدار 1.0، Sep 2025
Windows, Mac
4.5
التقييمات: 2
الوصف
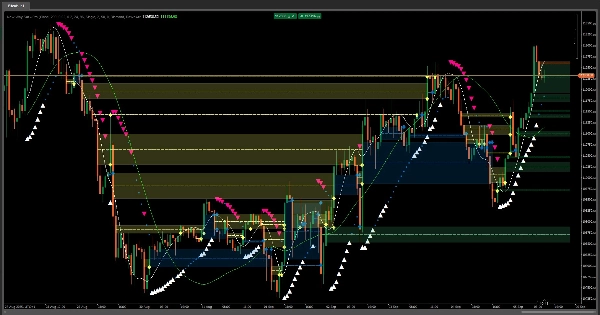
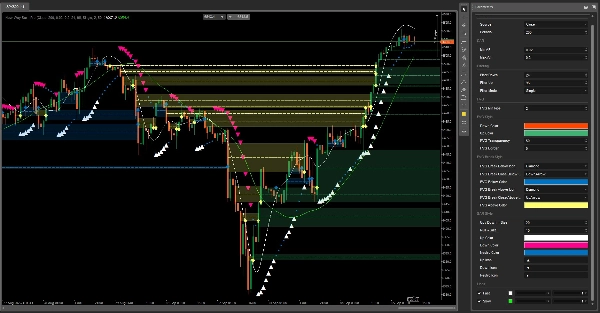
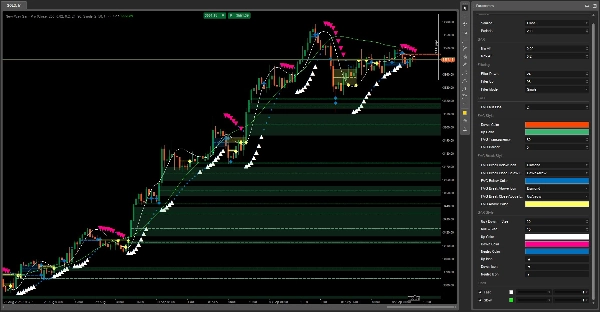
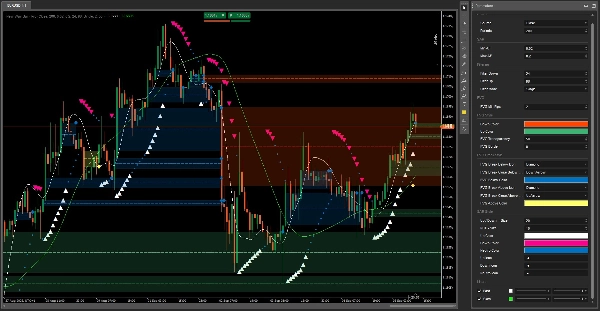
المؤشر التبادلي التربيعي، أو "التوقف والانعكاس"، هو أداة تحليل فني ديناميكية تساعد المتداولين على تحديد احتمالات انعكاس الاتجاه وتعيين أوامر وقف الخسارة المتحركة. على عكس المؤشرات التقليدية، ينشئ المؤشر التبادلي التربيعي سلسلة من النقاط التي تتبع حركة السعر، وتتعدل مع اكتساب الاتجاه للزخم.
نسختنا الحديثة تقدم نهجًا جديدًا وبديهيًا لهذا المؤشر الكلاسيكي. من خلال دمج إشارات قوية وموثوقة مع تصميم نظيف وحديث، يساعد المتداولين على تصور اتجاه الاتجاه ونقاط الدخول أو الخروج المحتملة بسهولة. من خلال دمج مستويات السوق الرئيسية مثل فجوات القيمة العادلة، توفر هذه النسخة نظامًا شاملاً لاتخاذ قرارات تداول أكثر دقة وثقة، مما يمنحك الوضوح اللازم للتنقل في الأسواق بثقة.
الملخص
ملف تعريف المؤشر
تقييمات العملاء
4.5
التقييمات: 2
5 | 50 % | |
4 | 50 % | |
3 | 0 % | |
2 | 0 % | |
1 | 0 % |
تقييمات العملاء
October 8, 2025
Smooth and smart SAR! 🔄 Adapts to volatility, cuts false flips, and keeps your trades on trend. Perfect for swing and trend lovers who want cleaner signals without the noise."
September 18, 2025
A calm trader gets value from weak ideas are easier to skip. It can look better than it is during a lucky run.
مناقشة
الأسئلة الشائعة
Prop
Forex
Signal
Scalping
Indices
Supertrend
Commodities
Crypto
Stocks
يتم توفير المنتجات المتاحة من خلال cTrader Store، بما في ذلك روبوتات التداول والمؤشرات والإضافات، من قبل مطوري الطرف الثالث وإتاحتها لأغراض الوصول المعلوماتي والفني فقط. cTrader Store ليس وسيطًا ولا يقدم نصائح استثمارية أو توصيات شخصية أو أي ضمان للأداء المستقبلي.


السعر
147
المبيعات
11.19K
التثبيتات المجانية