Session Liquidity Map Pro
インジケーター
バージョン 1.0、Jul 2026
Windows、Mac
Trading product for Session Liquidity Map Pro インジケーター Premium/Discount  Supertrend, image 2
Trading product for Session Liquidity Map Pro インジケーター Premium/Discount  Supertrend, image 3
Trading product for Session Liquidity Map Pro インジケーター Premium/Discount  Supertrend, image 4
Trading product for Session Liquidity Map Pro インジケーター Premium/Discount  Supertrend, image 5

説明

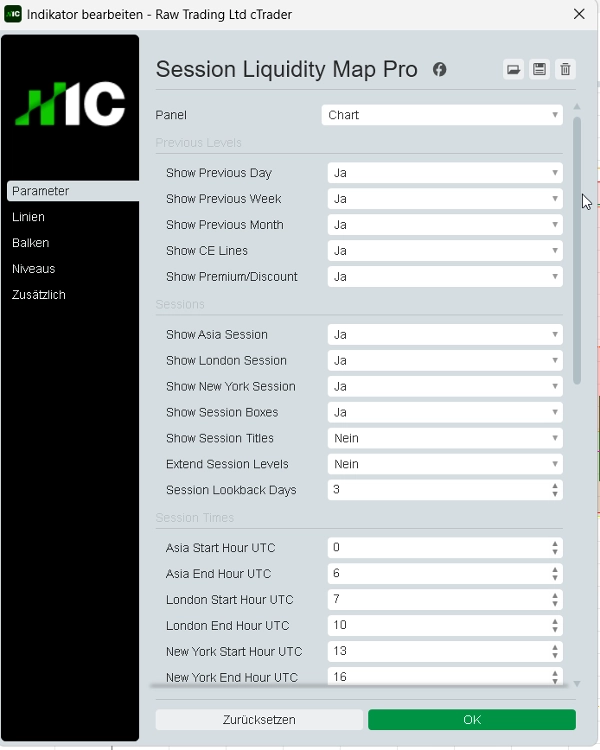
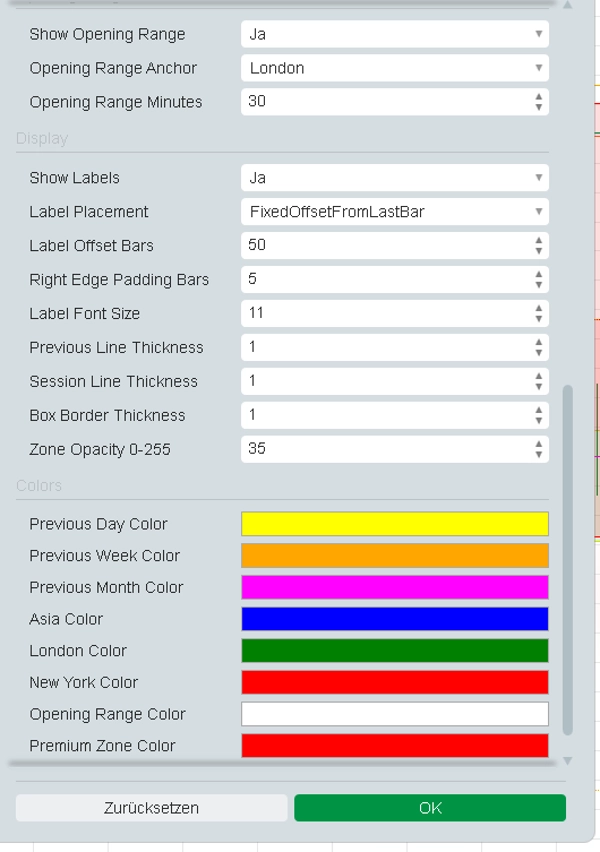
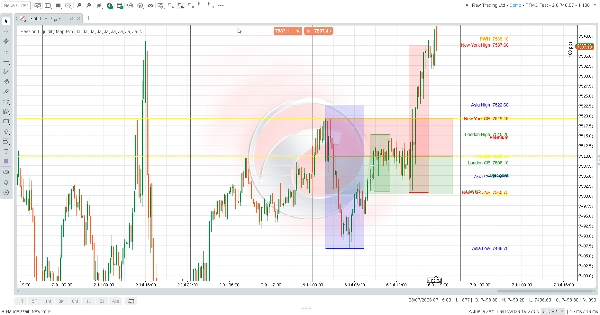
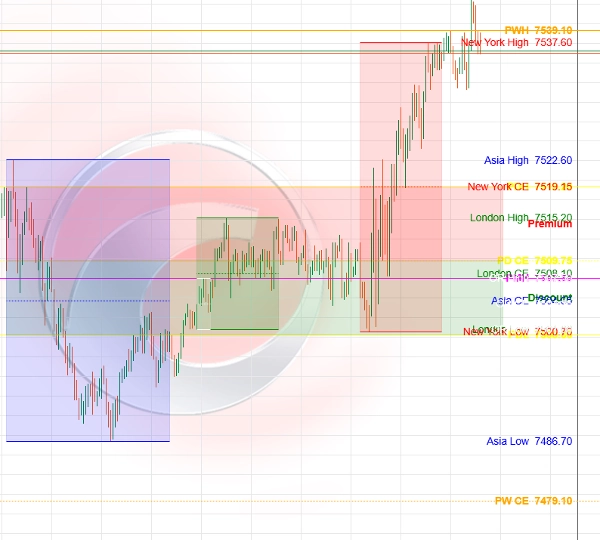
Session Liquidity Map Proは、構造化された価格アクション分析のための視覚的なcTraderインジケーターです。前日の高値/安値、週および月の高値/安値と均衡レベル、アジア/ロンドン/ニューヨークのセッションレンジ、オープニングレンジレベル、プレミアム/ディスカウントゾーンを自動的に表示します。


このインジケーターは、チャートの準備、流動性に基づく分析、市場構造のレビュー、およびバックテスト研究のために設計されています。取引を実行せず、買い/売りのシグナルを提供せず、フルアクセスも必要としません。


取引にはリスクが伴います。過去のパフォーマンスは将来の結果を保証するものではありません。

概要

AIによる概要
Session Liquidity Map Pro is a visual indicator for the cTrader platform designed to enhance structured price action analysis. It automatically maps key market data on your chart, including previous day, week, and month highs and lows, equilibrium levels, and session ranges for Asia, London, and New York. The indicator also highlights opening range levels and premium/discount zones, aiding in liquidity-based analysis and market structure review.
This tool supports chart preparation and backtesting research by visually presenting critical price levels and zones relevant to market participants. It does not execute trades or provide buy/sell signals and operates without requiring full access permissions. The indicator is categorized under market structure and provides visual outputs to assist traders in identifying liquidity sweeps, market structure shifts, key levels, and premium/discount areas.
Session Liquidity Map Pro is suitable for traders focusing on market structure concepts and price action analysis, offering a comprehensive overview of session dynamics and historical price points to inform trading decisions.
インジケーターのプロフィール
インジケーターのカテゴリー
市場構造(SMC)
出力の種類
ビジュアル表示
データ要件
バーのみ
サポート対象のシグナル
反転
ブレイクアウト
トレンドの強さ
ラインタッチ
ラインブレイク
セッション開始レンジ

カスタマーレビュー

0.0
レビュー: 0
カスタマーレビュー
この商品にはまだレビューがありません。お使いになったことがある方は、ぜひレビューをお願いします。

ディスカッション

よくあるご質問

Premium/Discount
Supertrend
Key Levels
MSS
Liquidity Sweep
Market Structure
cTrader Storeで入手可能な取引ボット、インジケーター、プラグインなどの商品は、第三者の開発者が提供するものであり、情報と技術の取得のみを目的としてご利用いただけます。cTrader Storeはブローカーではなく、投資助言や個人的な推奨を行うことも、将来のパフォーマンスを保証することもありません。


この作成者の他の商品

インジケーター
SMC
Prop
+6
Automatically draws the Opening Range (High & Low) for Tokyo, London, and New York sessions. Configurable start times,
インジケーター
Liquidity Grab
Liquidity Sweep
+2
Visualizes accumulation ranges, manipulation sweeps and distribution phases on your cTrader chart.
インジケーター
BOS
Key Levels
+2
Maps bullish and bearish order block zones, CE levels and structure-based price action context.
インジケーター
Key Levels
Liquidity Grab
+3
Visual market context dashboard showing bias states, CE positioning, session status and sweep context.
インジケーター
SMC
Prop
+12
Killzone, ICT, SMC, Session, Asia, London, New York, NY PM, Session High, Session Low, Smart Money, Order Flow, Trading
インジケーター
MSS
Key Levels
+2
Maps equal highs, equal lows and active liquidity pools directly on your cTrader chart.
インジケーター
EMA
RSI
+2
Compact premium cTrader dashboard for market bias, sessions, premium/discount context, liquidity direction, ADR range an
インジケーター
BOS
MSS
+3
Maps BOS, CHoCH, swing breaks and market structure shifts directly on your cTrader chart.
インジケーター
SMC
Prop
+12
Shows bullish/bearish bias for 5 timeframes in one panel. Three bias methods, alignment summary, fully configurable.

これも好きかも

インジケーター
Breakout
FlexSR auto‑detects pivot highs/lows to plot dynamic support & resistance lines Features customizable styling and option
インジケーター
SMC
Prop
+12
Multi-TF FVG + Smart Fibonacci
インジケーター
Breakout
Institutional Flow Radar scans the chart for abnormal volume events and classifies them into two groups: Capital &Public
インジケーター
RSI
SMC
+17
RSI, MACD, Stochastic, CCI & Momentum divergence scanner with confluence scoring. Never miss a signal again!
インジケーター
Volume
Key Levels
+5
Volume Profile Pro - A Lightweight and Highly Customizable Volume Profile
インジケーター
ATR
RSI
+1
AI Supertrend MTF uses K-NN Machine Learning to eliminate lag. Features multi-timeframe projection & dynamic glowing clo
インジケーター
SMC
Prop
+16
Multi-Time Frame Candlesticks FVG with BSL/SSL Premium Suite
インジケーター
Aggressive
Supertrend
+5
Stop trading with tunnel vision! 🚫 The Heat Map Dashboard is an institutional-grade visual trading assistant
インジケーター
RSI
Signal
+1
🚀📈 Plot buy/sell signals on Range Bars using Moving Averages and RSI. Clear, actionable trading insights.🚀📈
インジケーター
MSS
Key Levels
+2
Maps equal highs, equal lows and active liquidity pools directly on your cTrader chart.
インジケーター
ATR
Market Structure
Adaptive multi timeframe market condition analyzer that identifies the most tradeable timeframe.
インジケーター
AI-assisted
Order Block
+5
The daily bias estimator indicator uses ICT concepts to show whether the chart is bullish or bearish on multi-time frame
インジケーター
AI
ATR
+27
Supertrend Indicator
インジケーター
Displays the previous day's, last week's, and last month's highest and lowest price levels on your chart.
インジケーター
AI
Prop
+7
EMA Clouds, Multi-Timeframe (MTF) Overlay, Swing High/Low detection, and a smart Dashboard with neutral zone filtering.
インジケーター
SMC
Prop
+14
FVG Multi Time Frame Indicator
インジケーター
Customizable window inside your platform, access to any website Calendar
インジケーター
AI
ATR
+19
Market Cipher A

価格