
説明
定量定性推定(QQE)マルチタイムフレームインジケーター
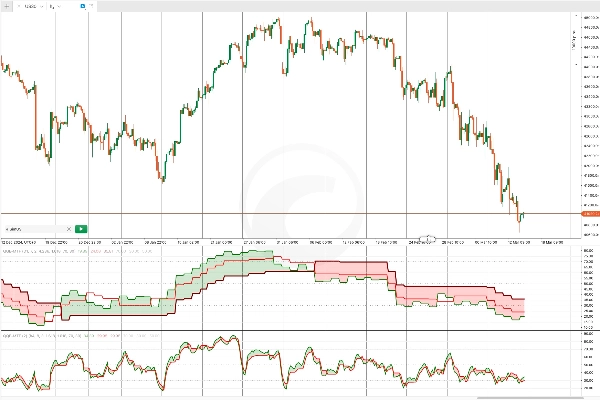
この 定量定性推定(QQE)インジケーター は、スムーズ化移動平均を組み込むことで 相対力指数(RSI) を強化したテクニカル分析ツールです。トレーダーが トレンドの強さ、潜在的な反転、買われ過ぎ/売られ過ぎの状態 をより正確に評価するのに役立ちます。
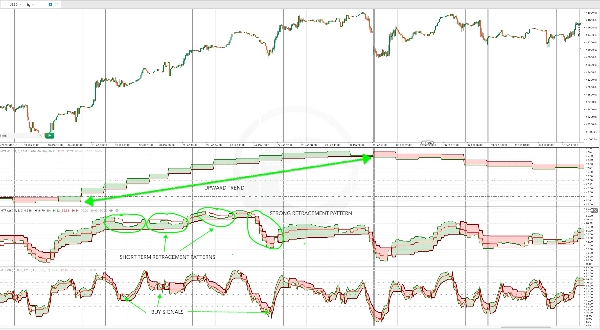
QQEは2つの主要な要素を特徴としています:動的なサポートとレジスタンスとして機能する 高速および低速のトレーリングストップレベル。これにより、 トレンドフォローおよび平均回帰戦略 の両方に対応できる多用途なツールとなっています。 QQEラインとそのシグナルラインのクロスオーバー は、しばしば潜在的な 買いまたは売りの機会 を示します。
マルチタイムフレームQQE:高度なバージョン
この強化版QQEインジケーターは マルチタイムフレームツール として設計されており、 高速および低速のトレンドライン を統合して精度を向上させています。複数のタイムフレームにわたる価格動向を分析することで、 市場トレンドの包括的なビュー を提供します。
その 高度なスムージングアルゴリズム により信頼性が向上し、以下の目的で効果的な単独インジケーターとなっています:
✅ トレンド方向の特定
✅ 正確なエントリーおよびエグジットシグナルの生成
✅ 買われ過ぎおよび売られ過ぎの状態の検出
マルチタイムフレームQQEの柔軟性により、 トレンドフォローおよび反転戦略 の両方に適しています。
マルチタイムフレームQQEの使い方
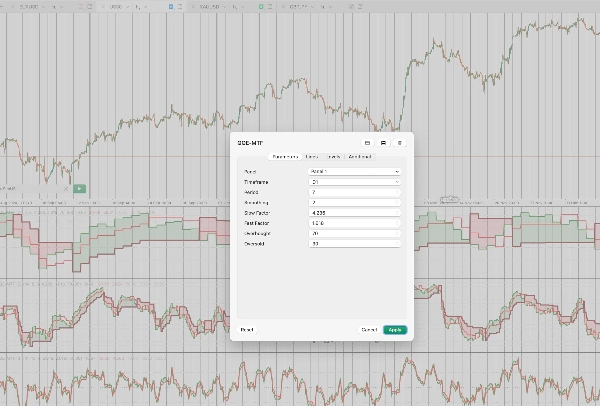
マルチタイムフレームQQEを設定するには、トレーダーは以下を選択する必要があります:
🔹 タイムフレーム(例:日足、H4、H1)
🔹 期間(計算に使用されるローソク足の数)
🔹 スムージング期間(RSIのスムージング用)
🔹 遅延および高速ファクター(感度調整用)
🔹 カスタマイズ可能な買われ過ぎおよび売られ過ぎレベル
📌 注意: これはマルチタイムフレームインジケーターであるため、チャートに追加した後、 cTraderインターフェースでズームアウト して十分なデータを読み込み、インジケーターを正しく初期化することが重要です。
マルチタイムフレームQQEを使ったトレーディング戦略
1️⃣ 高タイムフレームのトレンド確認のためのQQE
マルチタイムフレームQQEの効果的な使い方の一つは、 高タイムフレームでのトレンド確認 を行い、低タイムフレームでの押し目エントリーを特定することです。
例えば:
- 日足タイムフレームのQQE を使って強いトレンドを確認します。
- 押し目エントリー は、 ストキャスティクスオシレーター が買われ過ぎまたは売られ過ぎレベルをクロスしたときに特定されます。
この方法は、トレーダーが全体のトレンドに合わせてエントリーを調整するのに役立ちます。
2️⃣ より深い市場洞察のためのマルチタイムフレーム分析
複数のタイムフレームにわたって QQEを使用する ことで、トレーダーは資産の動きをより詳細に理解できます。
例えば、QQEを以下に適用することで:
📊 日足タイムフレーム(D1): 全体のトレンド方向を決定します。
📊 4時間タイムフレーム(H4): トレンド方向を確認し、短期のプルバックを特定します。
📊 1時間タイムフレーム(H1): 買われ過ぎ/売られ過ぎの状態や逆トレンドの動きに基づく正確なエントリーシグナルを生成します。
この構造化されたアプローチにより、異なるタイムフレーム間でシグナルを整合させることで、 トレードのタイミングと意思決定 が向上します。
概要
This advanced multi-timeframe tool integrates fast and slow trend lines to analyze price action across different timeframes, providing a comprehensive view of market trends. Its smoothing algorithm improves reliability, making it effective for identifying trend direction, generating precise entry and exit signals, and detecting overbought/oversold levels.
Users configure the indicator by selecting a timeframe (e.g., Daily, H4, H1), periods for calculation, smoothing period for RSI, sensitivity factors, and customizable overbought/oversold thresholds. It is recommended to zoom out in the cTrader interface after adding the indicator to allow sufficient data loading.
Typical strategies include using the QQE on higher timeframes for trend confirmation and on lower timeframes for entry timing, as well as multi-timeframe analysis to enhance trade timing and decision-making by aligning signals across timeframes.
カスタマーレビュー
5 | 50 % | |
4 | 50 % | |
3 | 0 % | |
2 | 0 % | |
1 | 0 % |


![「[Stellar Strategies] Market Session Ultimate」ロゴ](https://cdn.ctrader.com/image/webp/61ffd537-0125-4246-9e72-42eca1791d64_28232)


