説明
概要
このインジケーターは、Alfred François Tagherによる「価格と時間のフィルタリングによるトレンド識別」手法を実装しており、2024年2月号のTechnical Analysis of Stocks & Commodities誌に掲載されています。
このコンセプトは、価格の動きと時間ベースのフィルタリングを組み合わせて市場のノイズを減らし、持続的なトレンドを識別します。すべての価格変動に反応するのではなく、前期間のレンジを超えて価格が終値をつけたときのみトレンド方向を変更します。これはランダムな変動ではなく、真のモメンタムを示す条件です。
基本ルール
元のルールはシンプルです:
- 期間の終値が前期間の高値を超えた場合 → トレンドは上昇
- 期間の終値が前期間の安値を下回った場合 → トレンドは下降
- 反転条件が発生するまでトレンドは変わらない
このアプローチは、前期間のレンジ内にとどまる小さな価格変動をフィルタリングし、コミットメントを示すブレイクアウトのみに焦点を当てます。
動作原理
インジケーターは、現在の時間枠の終値を選択された上位時間枠の前期間の高値と安値と比較します:
- トレンド上昇: 現在の終値 > 前期間の高値
- トレンド下降: 現在の終値 < 前期間の安値
- 変化なし: 終値は前期間のレンジ内に留まる
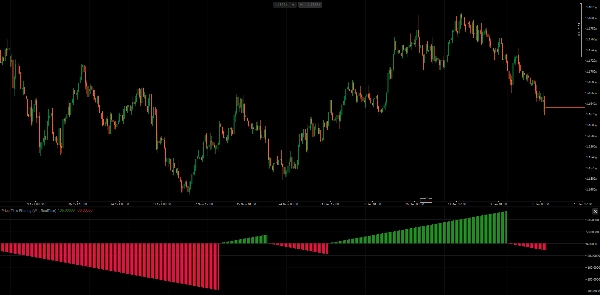
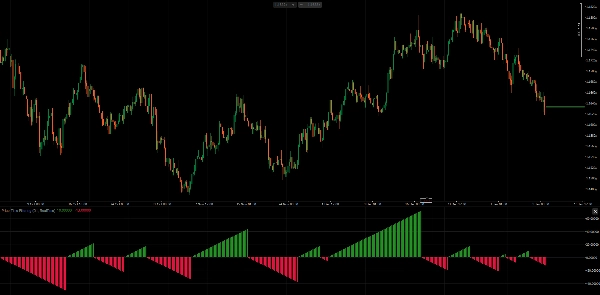
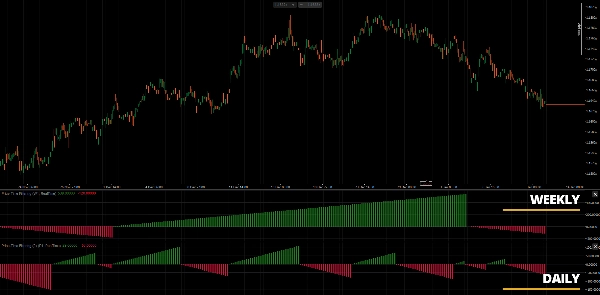
ヒストグラムは現在のトレンド方向のバー数をカウントして表示します。上昇トレンドでは正の値、下降トレンドでは負の値となり、トレンドの方向と期間を視覚化します。
フィルタリングモード
1. PeriodEndモード 上位時間枠の期間が完了した時のみトレンドを評価します。これは元の手法に一致し、週次トレンドは金曜日の終値(月次の場合は月末の終値)で決定されます。より安定し、シグナルは少なめです。
2. RealTimeモード 現在の終値を前期間のレンジと比較し、すべてのバーでトレンドを評価します。より早いシグナルを提供しますが、期間中にノイズが多くなる可能性があります。
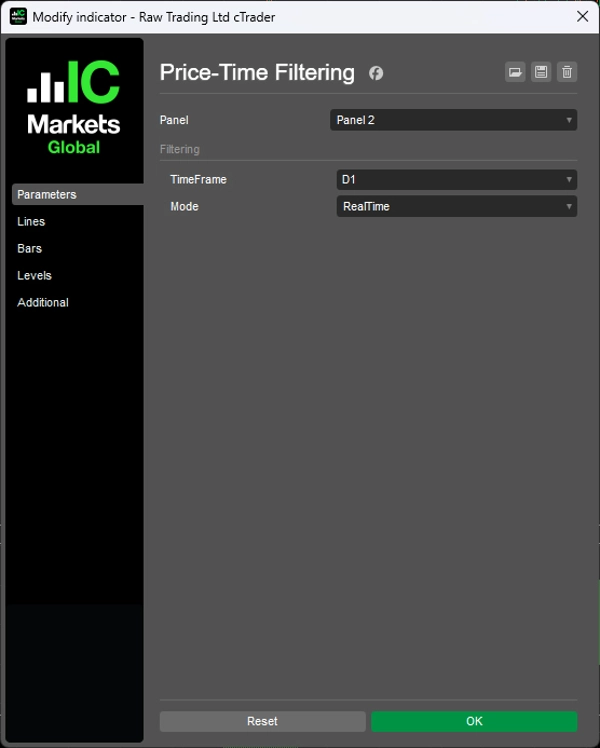
パラメーター
- TimeFrame: トレンド評価のための上位時間枠(例:週次、月次)
- Mode: PeriodEnd(元の手法)またはRealTime(応答性の高いバリアント)
解釈
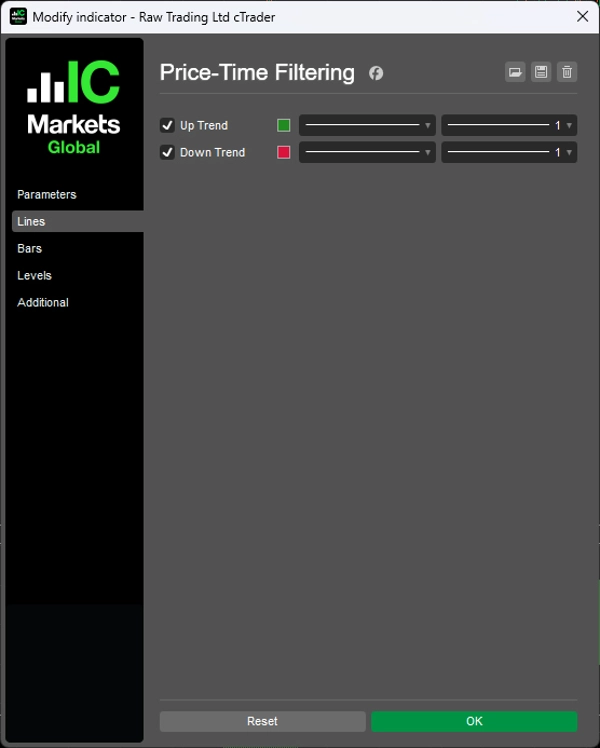
- 緑のヒストグラム: 上昇トレンド進行中、バー数は期間を示す
- 赤のヒストグラム: 下降トレンド進行中、バー数は期間を示す
- ヒストグラムリセット: トレンドの反転が発生した
このインジケーターは、元の記事で説明されているように、週次または月次の時間枠選択を用いた日足チャートで最も効果的に機能します。ただし、実装は任意の時間枠の組み合わせをサポートしています。
注意事項
- 元々は週次/月次評価を用いた日足チャート向けに設計されました
- 選択された時間枠がチャートの時間枠より上位である任意の時間枠の組み合わせで動作します
- バー数はトレンドの成熟度を示し、長いカウントは確立されたトレンドを示唆します
- エントリータイミングには価格構造分析との併用を検討してください
参考文献
Tagher, Alfred François. "Trend Identification By Price And Time Filtering." Technical Analysis of Stocks & Commodities, 2024年2月号.
__________________________________________________________________________________________
その他の無料インジケーター
構造や出来高から回帰、ボラティリティ、カスタム時間枠まで、幅広い市場分析ツールを探求してください。
ソースコードはGitHub リポジトリで入手可能です。
すべて無料で使用できますが、コーヒーサポートを送りたい場合は こちらからどうぞ。
サポート/レジスタンス
出来高
- ボリュームアクティビティプロファイラー
- ボリュームエフィシェンシーアナライザー
- ボリュームプロファイル分析
- ボリュームプロファイル - 更新版
- ボリュームスプレッド分析
- VWAP(出来高加重平均価格)
移動平均線
- SSLチャネル
- アンカード移動平均線
- 偏差スケール移動平均線
- ギャン高安アクティベーター
- 瞬時トレンドライン
- カウフマン適応MAとトレンドビジョン
- 移動平均チャネル
- 移動平均スイート
- トレンドチャネル移動平均線
ユーティリティ/カスタム
回帰ベース
ボラティリティ
オシレーター
__________________________________________________________________________________________
免責事項
取引にはリスクが伴います。このインジケーターはあくまでテクニカル分析用であり、常に適切なリスク管理を行い、責任を持って取引してください。
フィードバックと改善
ご提案や機能リクエスト、改善アイデアがありましたら、ディスカッションタブにコメントを残してください。皆様のフィードバックはインジケーターの改善に役立ちます。
概要
The indicator supports two filtering modes: PeriodEnd mode, which evaluates trends only at the close of a higher timeframe period (e.g., weekly or monthly), providing more stable signals; and RealTime mode, which updates trend status on every bar for more responsive but potentially noisier signals. Users can select the higher timeframe for trend evaluation, typically weekly or monthly, while applying the indicator on lower timeframe charts.
A histogram visually represents trend direction and duration, with positive values and green bars indicating uptrends, negative values and red bars indicating downtrends, and resets marking trend reversals. The indicator is applicable across various markets including Forex, indices, commodities, crypto, and stocks, and supports any timeframe combination where the selected higher timeframe exceeds the chart timeframe.