
説明
カスタマイズ可能なクラシックなMACDインジケーターをご紹介します。パーソナライズされた機能でトレーディング体験を向上させるよう設計されています。
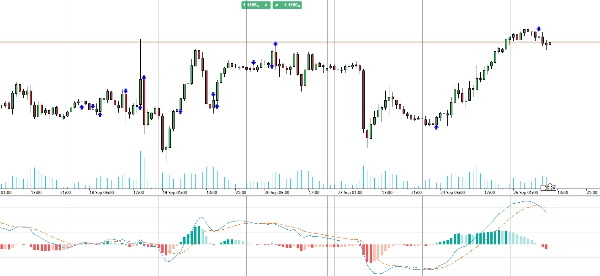
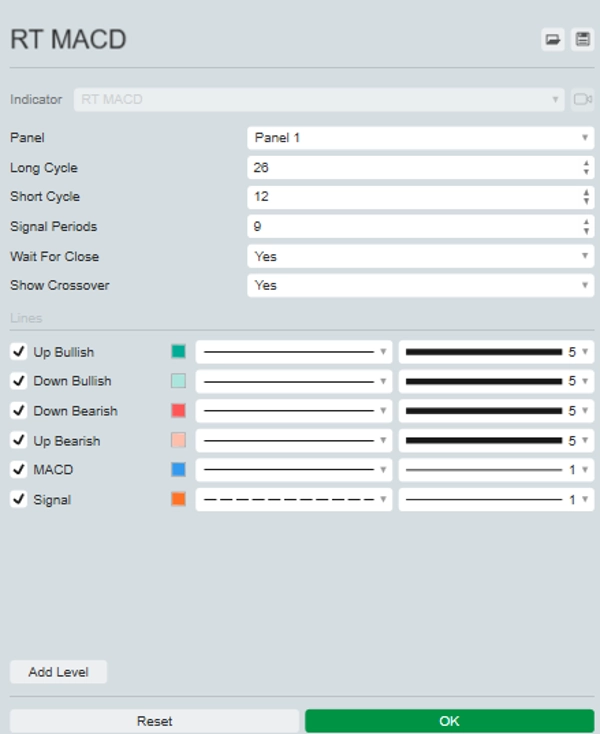
従来のMACDのこのアップグレード版では、ラインやヒストグラムの色をカスタマイズでき、チャートの視認性が向上します。オプションで、ローソク足の終値ではなくティックデータを使用してリアルタイムに更新することも可能で、スピーディーな市場でのタイムリーな洞察を提供します。
さらに、チャート上にクロスオーバーポイントを強調表示し、買いおよび売りのシグナルを見つけやすくします。
カスタマイズ可能なクラシックなMACDインジケーターでトレーディング戦略を強化し、精度と意思決定を向上させましょう。
概要
インジケーターのプロフィール
カスタマーレビュー
0.0
レビュー: 0
カスタマーレビュー
この商品にはまだレビューがありません。お使いになったことがある方は、ぜひレビューをお願いします。
ディスカッション
よくあるご質問
BTCUSD
Forex
Signal
Indices
EURUSD
Commodities
GBPUSD
NZDUSD
Prop
Scalping
Crypto
Stocks
XAUUSD
NAS100
MACD
USDJPY
cTrader Storeで入手可能な取引ボット、インジケーター、プラグインなどの商品は、第三者の開発者が提供するものであり、情報と技術の取得のみを目的としてご利用いただけます。cTrader Storeはブローカーではなく、投資助言や個人的な推奨を行うことも、将来のパフォーマンスを保証することもありません。


価格
登録日 25/09/2024
20
販売