
الوصف
QX SmartStructure (QX SS)
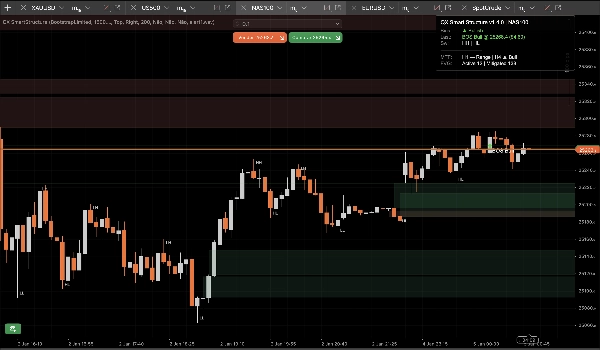
QX SmartStructure (QX SS) هو طبقة SMC خفيفة الوزن بحافة يمين حادة لـ cTrader. يعرض الهيكل الحالي، وكسر BOS/CHoCH، ومناطق FVG المصفاة والمدارة تلقائيًا، ولوحة تحيز MTF مدمجة لـ H1/H4 حتى تتوقف عن تبديل الأطر الزمنية.
أداة تصور فقط. لا تقوم بوضع صفقات.
ما الذي يعرضه
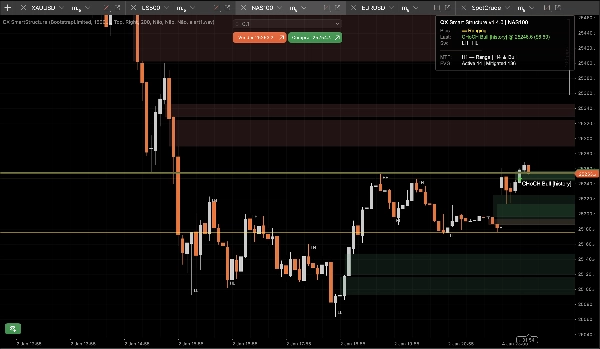
1) هيكل سوق نظيف (حافة يمين حادة)
- تسميات التأرجح: HH / HL / LH / LL
- المستويات الرئيسية: أعلى تأرجح مؤكد أخير و أدنى تأرجح مؤكد أخير
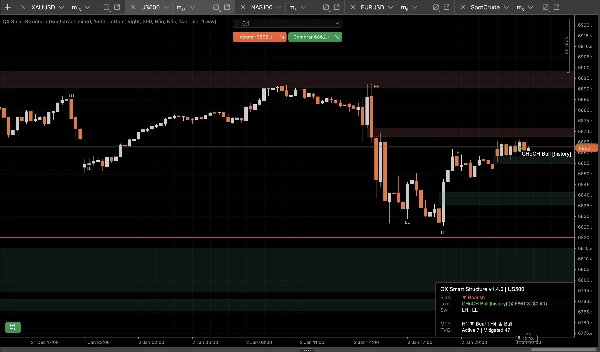
- أحداث الكسر: BOS / CHoCH مع القوة (قوي مقابل ضعيف)
- أنماط العرض:
-
- ActiveOnly (الحد الأدنى)
- RecentSwings (سياق محكم)
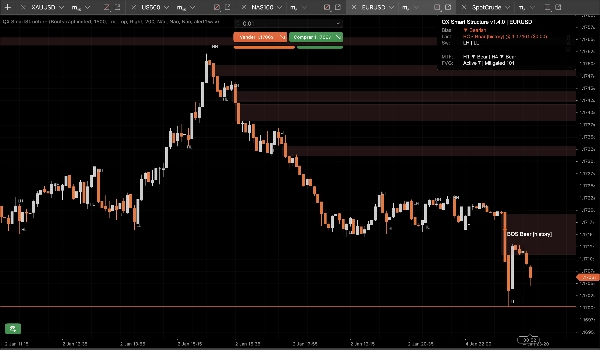
2) مناطق FVG التي تبقى تحت السيطرة
- مستطيلات FVG الصعودية والهبوطية
- الحد الأدنى لحجم FVG (خطوات) يقوم الفلتر بإزالة الفجوات الصغيرة تلقائيًا
- قاعدة التخفيف 50% (معتمدة على الفتيل): تصبح المنطقة مخففة عندما يصل السعر إلى نصف مستواها
- دورة الحياة:
-
- الإخفاء التلقائي للمخففة = تشغيل لأوضح رسم بياني
- إيقاف يحافظ على المناطق المخففة كـ "سياق شبح" (شفافية أقل)
- الحدود الصارمة تمنع ازدحام الكائنات خلال الجلسات الطويلة (مخزنة/مرسومة/تمديد إلى اليمين)
3) لوحة تحيز MTF (H1 / H4)
تعرض لوحة مدمجة:
- تحيز الإطار الزمني الحالي: صعودي / هبوطي / متراوح / غير معروف
- آخر حدث: BOS/CHoCH، الاتجاه، القوة
- لقطات اختيارية: تحيز H1 و تحيز H4
4) تنبيهات صوتية اختيارية
تنبيهات صوتية فقط للكسر، مع:
- اختياري تنبيه على الكسور الضعيفة
- اسم ملف صوت مخصص
ميزة StepSize (الفوركس، الذهب، المؤشرات)
معظم أدوات الهيكل تنهار عند تغيير الرموز لأنها تفترض أن "النقاط" تعني نفس الشيء في كل مكان.
يستخدم QX SS StepSize كوحدة عالمية: TickSize → PipSize → Digits fallback
تحويل أي مسافة إلى خطوات
الخطوات = مسافة السعر ÷ TickSize
أمثلة (أحجام تيك شائعة):
- EURUSD TickSize 0.00001: 1 نقطة (0.00010) = 10 خطوات
- XAUUSD TickSize 0.01: 0.10$ = 10 خطوات، 1.00$ = 100 خطوة
- تختلف المؤشرات حسب الوسيط:
أين تجد TickSize
- في cTrader Automate: Symbol.TickSize (يقرأها QX SS بأمان)
- في واجهة المنصة: لوحة مواصفات الرمز (معلومات رمز مراقبة السوق)
الحجم الأدنى الموصى به لـ FVG (خطوات)
هذه نطاقات بدء عملية، وليست حقائق عالمية. التقلب والجلسة مهمان.
M15 (سير العمل الافتراضي)
- EURUSD: 20–40 خطوة (≈ 2–4 نقاط إذا كان TickSize = 0.00001)
- XAUUSD: 30–120 خطوة (≈ 0.30$–1.20$ إذا كان TickSize = 0.01)
- US500 / NAS100: اختر حركة ذات معنى بالنقاط، ثم حوّل:
M5 (نعم، يتغير)
M5 يطبع المزيد من الفجوات الصغيرة. إذا احتفظت بنفس MinFVGSteps ستقوم بتصفية الكثير جدًا.
التعديل النموذجي: خفض MinFVGSteps بحوالي 30–50% مقابل قيمة M15 الخاصة بك، ثم إعادة الضبط.
"التراوح" ليس خطأ!
يصبح التحيز متراوحًا عندما لا تتماشى قمم/قيعان التأرجح الأخيرة بوضوح كـ HH+HL أو LH+LL.
في حالة التذبذب، الأداة التي تبقى "صعودية" إلى الأبد تكذب. QX SS محافظ بطبيعته.
الإعدادات المسبقة (نقاط البداية)
الإعداد المسبق A: "M15 متوازن" (الافتراضي الموصى به)
- قوة التأرجح (M15=7): 7
- نوع الكسر: الإغلاق
- مؤكد فقط: صحيح
- وضع العرض: RecentSwings
- عدد التأرجحات الأخيرة: 30
- الحد الأدنى لحجم FVG (خطوات): EURUSD 25 | XAUUSD 60 | المؤشرات 15 (ثم ضبط)
- الإخفاء التلقائي للمخففة: صحيح
- الحد الأقصى لرسم FVG: 30
- تمديد الأشرطة إلى اليمين: 50
- عرض MTF H1: صحيح
- عرض MTF H4: صحيح
الإعداد المسبق B: "M15 رسم بياني نظيف"
- وضع العرض: ActiveOnly
- عرض تسميات التأرجح: خطأ
- الإخفاء التلقائي للمخففة: صحيح
- الحد الأقصى لرسم FVG: 15–20
- (احتفظ بالباقي من الإعداد المسبق A)
الإعداد المسبق C: "سياق تقشير M5"
- قوة التأرجح: 5–6
- نوع الكسر: أي منهما
- مؤكد فقط: صحيح (ابدأ بصرامة)
- عرض الكسور الضعيفة: خطأ
- الحد الأدنى لحجم FVG (خطوات): ~50–70% من قيمة M15 الخاصة بك
- عدد التأرجحات الأخيرة: 20–30
- تمديد الأشرطة إلى اليمين: 30–50
تكامل cBot / الأتمتة (ما يكشفه QX SS)
يكشف QX SmartStructure عن 3 سلاسل داخلية لـ cBots:
- BiasSeries: 1 صعودي، -1 هبوطي، 0 خلاف ذلك
- BreakSignalSeries: 1 كسر صعودي، -1 كسر هبوطي، 0 خلاف ذلك
- BreakLevelSeries: مستوى السعر على شريط الحدث، NaN خلاف ذلك (حارس نظيف)
الثبات والأداء (الإصدار 1.5.1+)
مصمم لإعدادات متعددة الرسوم البيانية والجلسات الطويلة:
- يعالج فقط على الأشرطة المغلقة الجديدة
- تحديثات واجهة المستخدم محدودة بواسطة UI Throttle (مللي ثانية) للحفاظ على انخفاض استخدام المعالج
- أعداد الكائنات المحددة والحدود القصوى للتقليم تمنع ازدحام الرسم البياني
- يكشف بأمان عن "إعادة تحميل صعبة" حقيقية (إعادة تحميل الإطار الزمني/الرمز/التاريخ) ويعيد بناء الحالة بدون انحراف
خيارات أمان جديدة (الإصدار 1.5.1+)
إبطال عند قفزة فجوة (افتراضي تشغيل)
إذا قفز السعر و تجاوز منطقة FVG دون لمسها (فتح عطلة نهاية الأسبوع/الأخبار)، يتم وسم المنطقة كملغاة بسبب الفجوة بدلاً من البقاء نشطة.
هذا يمنع بقاء المناطق القديمة على الرسم البياني بعد افتتاحات عنيفة.
مسح كامل للسلسلة عند إعادة البناء (افتراضي إيقاف)
عند إعادة البناء الصعبة، يمسح اختياريًا كامل تاريخ سلاسل الإخراج المكشوفة لأقصى اتساق في الاختبار الخلفي/التصدير.
احتفظ بـ إيقاف لأفضل أداء على التواريخ الضخمة. شغّل تشغيل فقط لسير عمل الاختبار الخلفي العميق الذي يحتاج إلى تكامل تاريخي كامل.
الإعدادات الافتراضية الموصى بها
- إبطال عند قفزة فجوة: نعم (تشغيل)
- مسح كامل للسلسلة عند إعادة البناء: لا (إيقاف)
إخلاء المسؤولية
هذه الأداة مخصصة فقط للتصور ودعم اتخاذ القرار. التداول محفوف بالمخاطر. استخدم دائمًا إدارة المخاطر الخاصة بك.
الملخص
It automatically detects and manages Fair Value Gap (FVG) zones, filtering out micro-gaps based on a configurable minimum size measured in steps, a universal unit derived from the symbol’s TickSize. The indicator applies a 50% mitigation rule to mark zones as mitigated when price reaches their midpoint, with options to auto-hide or display mitigated zones as ghosted.
QX SmartStructure includes a compact multi-timeframe (MTF) bias panel showing current timeframe bias (Bullish, Bearish, Ranging, or Unknown) and recent break events for H1 and H4 timeframes. Optional sound alerts notify users of break events, including weak breaks.
The tool supports various markets such as Forex, commodities (e.g., gold), indices, and cryptocurrencies by adapting to symbol-specific TickSize values. It exposes internal data series for integration with cBots and is optimized for performance with controlled object counts and throttled updates. The indicator does not place trades and is intended for decision support only.
تقييمات العملاء
5 | 100 % | |
4 | 0 % | |
3 | 0 % | |
2 | 0 % | |
1 | 0 % |


