
説明
通常の3グループのバンド:
期間:20
偏差:2.0;3.0; 3.5;
クラウド背景対応!
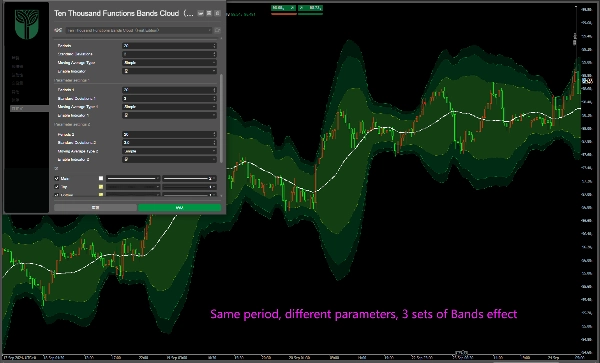
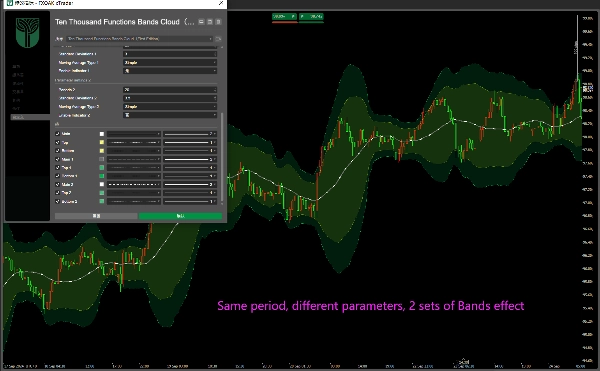
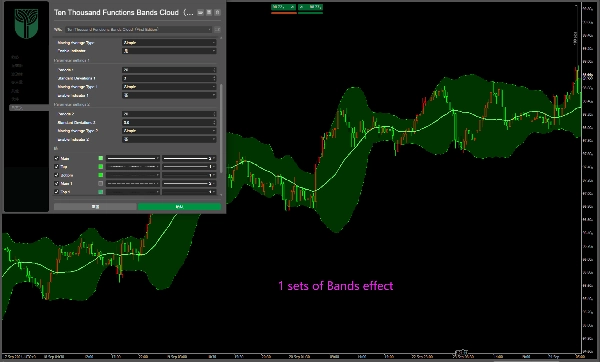
任意の1つまたは2つのグループを閉じたり開いたりできます。また、異なるパラメータを変更および設定できます!
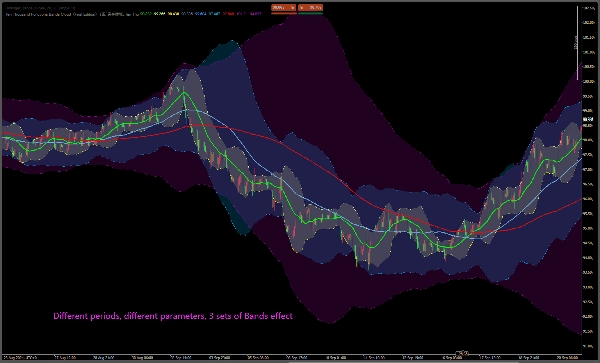
2.0:20、60、144バンドなど、他の値に変更することも可能です;
バンドの中央線は移動平均線に等しく、20、60、144の移動平均線です!
ボリンジャーバンドの中央線に基づいて、「デスバレー」と「ゴールデンマウンテンバレー」を判断および分析できます!
常規3組Bands:
周期:20
偏差:2.0;3.0; 3.5;
サポートクラウド背景!
任意の1つまたは2つのグループを閉じたり開いたりできます;また、異なるパラメータを変更および設定できます!
2.0:20、60、144ボリンジャーバンドなど、他の値に変更することも可能です;
バンドの中央線は移動平均線に等しく、すなわち20、60、144の移動平均線です!
ボリンジャーバンドの中央線に基づいて、「死亡谷」や「金山谷」などを判断・分析できます……
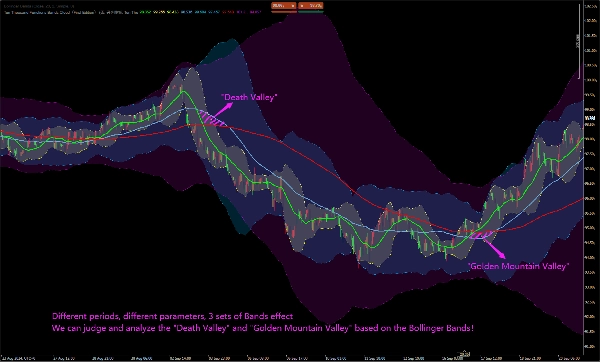
標準3グループボリンジャーバンド(Bands):期間:20;偏差値:2.0;3.0;3.5;クラウドバックグラウンドに対応!任意の1グループまたは2グループをオン/オフ設定することが可能です。また、各パラメーターの修正と設定も行えます。他の数値に変更することも可能です。例えば2.0の偏差値で、期間20、60、144のボリンジャーバンドに設定するなど。ボリンジャーバンドの中線は移動平均線に等しく、すなわち期間20、60、144の移動平均線です。ボリンジャーバンドの中線に基づいて、「デッドバレー(死亡谷)」や「ゴールドバレー(金山谷)」などを判断・分析することができます。
Стандартные 3 группы Бандов (Полос Боллинджера): Период: 20; Отклонение: 2,0; 3,0; 3,5; Поддержка облачного фона! Вы можете отключить или включить любую одну или две группы; кроме того, вы можете изменять и настраивать различные параметры! Его также можно изменить на другие значения, например, Боллинджеры с отклонением 2,0 и периодами 20, 60, 144; Средняя линия Бандов равна скользящей средней, то есть скользящим средним с периодами 20, 60 и 144! Мы можем определять и анализировать такие явления, как «Мёртвая долина» и «Золотая долина», на основе средней линии 。
概要
カスタマーレビュー
5 | 100 % | |
4 | 0 % | |
3 | 0 % | |
2 | 0 % | |
1 | 0 % |


