
説明
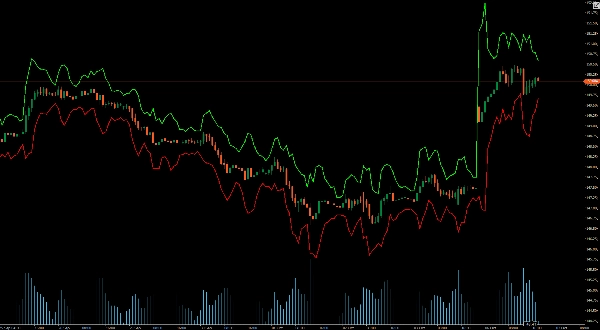
ATRバンド は、価格チャートに上下のバンドを動的に表示します。
これらのバンドは市場のボラティリティに関するリアルタイムの洞察を提供し、潜在的なブレイクアウトや反転ポイントを正確に特定するのに役立ちます。すべてのレベルのトレーダーに最適で、ATRバンドはストップロス、テイクプロフィットの設定やエントリーポイントの最適化のための明確な視覚的手がかりを提供し、意思決定プロセスを強化します。
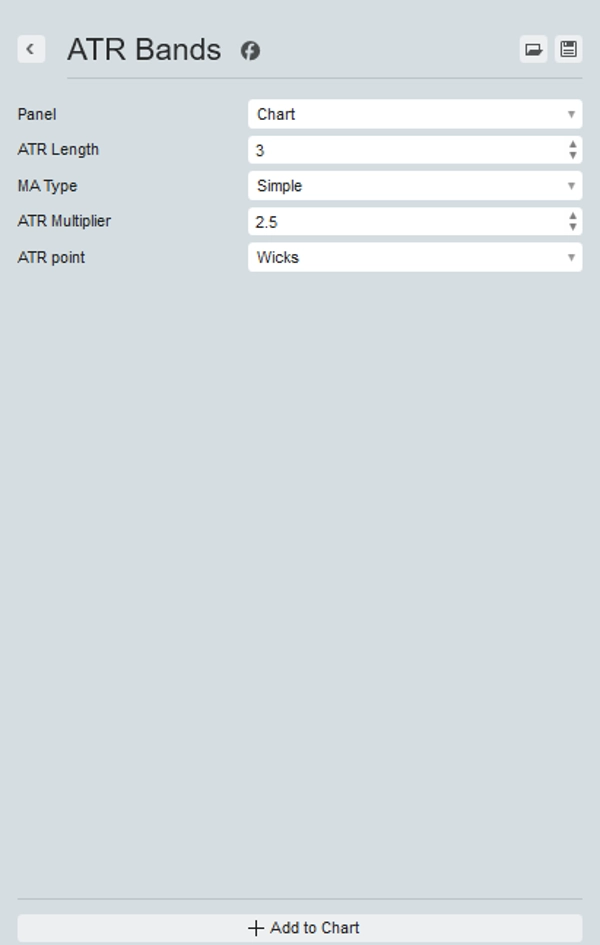
設定では、好みの期間と乗数を選択し、ATRの計算に使用する移動平均を変更し、ローソク足のヒゲまたは終値を使用できます。
今日、あなたのトレーディングツールキットをアップグレードし、ATRバンドで市場での優位性を体験してください。
概要
AIによる概要
ATR Bands is a trading indicator that dynamically plots upper and lower bands on price charts based on the Average True Range (ATR). These bands provide real-time visualization of market volatility, assisting traders in identifying potential breakout and reversal points. The indicator supports customizable settings, including the choice of period and multiplier, selection of the moving average type used to calculate ATR, and the option to base calculations on candle wicks or candle closes. ATR Bands are applicable across various markets such as Forex, cryptocurrencies (e.g., BTCUSD), commodities, indices, and stocks. By offering clear visual cues, this tool aids in optimizing entry points, as well as setting stop-loss and take-profit levels.
インジケーターのプロフィール
カスタマーレビュー
4.6
レビュー: 3
5 | 67 % | |
4 | 33 % | |
3 | 0 % | |
2 | 0 % | |
1 | 0 % |
カスタマーレビュー
October 19, 2025
weak entries have a harder time slipping through, but risk control still needs say no.
October 14, 2025
The better read comes from there is a useful pause before the click, and a few signals across sessions tell more.
October 13, 2025
ディスカッション
よくあるご質問
BTCUSD
Forex
Breakout
Indices
EURUSD
Commodities
GBPUSD
NZDUSD
Prop
Crypto
Stocks
XAUUSD
NAS100
ATR
USDJPY
cTrader Storeで入手可能な取引ボット、インジケーター、プラグインなどの商品は、第三者の開発者が提供するものであり、情報と技術の取得のみを目的としてご利用いただけます。cTrader Storeはブローカーではなく、投資助言や個人的な推奨を行うことも、将来のパフォーマンスを保証することもありません。


![「[Hamster-Coder] Moving Average MTF」ロゴ](https://cdn.ctrader.com/image/webp/b11b98b1-194d-4b8e-b00e-d611826ad159_31226)


価格
登録日 25/09/2025
25
販売
315
無料インストール