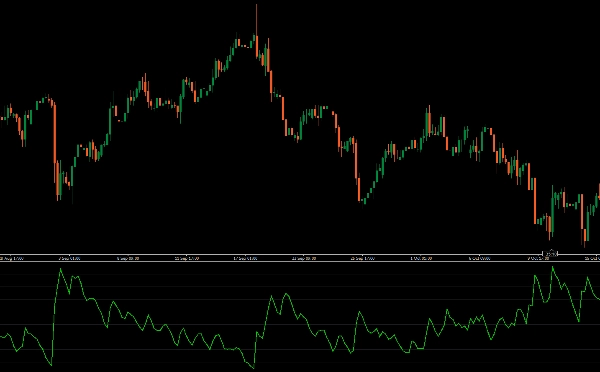
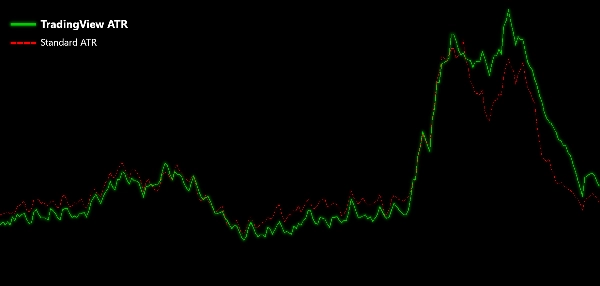
Логотип продукта "TradingView ATR"
TradingView ATR
Загруженное изображение продукта "TradingView ATR"
С 25/09/2025
21
Продажи
179
Бесплатные установки

Introducing the TradingView ATR indicator for cTrader, designed to match the precision of TradingView’s Average True Range calculation.

This enhanced ATR uses a Relative Moving Average (RMA) for its calculations, providing a more accurate reflection of market volatility compared to the default ATR in cTrader. By incorporating the RMA, this indicator offers smoother and more responsive volatility readings, helping you make better-informed trading decisions.

Perfect for traders seeking improved accuracy in their technical analysis, this ATR indicator is a powerful tool to elevate your trading strategy.

Upgrade your cTrader toolkit with this ATR indicator for precise and reliable volatility insights.

Профиль индикатора
0.0
Отзывы: 0
Отзывы покупателей
У этого продукта еще нет отзывов. Уже попробовали его? Поделитесь впечатлениями!
BTCUSD
Forex
Indices
EURUSD
Commodities
GBPUSD
NZDUSD
Prop
ATR
Crypto
Stocks
XAUUSD
NAS100
USDJPY
Продукты, доступные в cTrader Store, включая торговых ботов, индикаторы и плагины, предоставляются сторонними разработчиками и доступны исключительно в информационных и технических целях. cTrader Store не является брокером и не предоставляет инвестиционные консультации, персональные рекомендации или какие-либо гарантии будущей доходности.

Больше от этого автора

Professional execution engine for the Visual Risk Terminal. Instant batch orders, PnL syncing, and automated hedging.
1
Фактор прибыли
0%
Макс. просадка
Логотип продукта "Chandelier Exit"
$ 19
/
$20
Optimize exits with Chandelier Exit! Visualize stop-loss points dynamically for improved trading precision and safety.
Логотип продукта "ATR Bands"
$ 19
Enhance trading with ATR Bands! Visualize market volatility using dynamic upper and lower ATR bands for precise decision
Логотип продукта "MACD Histogram PRO"
$ 19
Enhance MACD Histogram! Visualize bull and bear price changes with vibrant colors for clearer, more insightful trading.
Unlock trading precision with QQE! Dual QQE indicators with a Bollinger Bands zero line provide clear buy/sell signals.
Customize the MACD! Choose colors, get real-time tick updates, and see crossover points for enhanced trading precision.
Логотип продукта "Consolidation Zones"
$ 19
Identify and trade breakouts with Consolidation Zones! Visualize price consolidation areas for trading opportunities.
Visual risk management terminal for cTrader. Set Lot size, SL, and TP via chart lines with real-time PnL projections.
Customize your Moving Average! Choose any timeframe and price source for precision and flexibility in your analysis.
Visualize trends with Standard Deviation Channel! Display median, and add customizable upper/lower deviation channels.
Логотип продукта "Stochastic RSI PRO"
5.0
(1)
$ 28
/
$40
Unlock Stochastic RSI PRO in cTrader! Overlay RSI, highlight zones, and identify divergences with customizable settings.
Advanced MACD & Supertrend bot. Professional trend-following logic with ATR risk management and active profit-taking.
18%
1.82
Фактор прибыли
20.05%
Макс. просадка

Вам также может понравиться

Time To Break Even Indicator. This indicator helps you time your trade's entry.
Complete MA-channel system: colored trend, channel boundaries & equilibrium with 6 Fib zones.
show symbol and time fram, daily net profit percent, daily net profit, and spread ln your chart. consider that timezone
The real-time speedometer allows you to know the speed of the market. Is it good time for trading? You will know now.
Auto Fill Alert on all Ur Markings. **Easy to mark on multiple devices using Alerts' Position
🔍 Divergence Indicator for cTrader (Update v1.1)
Pressure Scanner is a volatility-and-momentum to show both pressure states (squeeze on/off) and directional
Auto Fibonacci Retracement Pro – Smart Swing & Golden Zone Levels
The Floating Risk Indicator is an essential tool for traders who prioritize risk management.
Логотип продукта "BarCount"
4.5
(2)
Бесплатно
Bar count
FREE Candlestick Pattern Recognizer
NEW - PNLs as % - daily, weekly, monthly, or yearly & Spread, Time To Close, PNL Alerts, custom Bid / Ask lines
Regression Channel plots dynamic upper/lower bands around price to highlight trend direction, volatility, and potential
Super trend with support and resistance levels
njkfgtrwevwpkoye
TraderMax BB Filter X (FULL) for cTrader 📈 A premium signal tool based on Bollinger Bands + Trend Filter Designed for
Логотип продукта "ZScore"
5.0
(2)
Бесплатно
Z-Score measures price deviation from its average, helping identify extremes, trends, and trading opportunities ........
Track VWAP for Asia, London, NY, Sydney, Daily, Weekly, Monthly & Custom Sessions. Perfect for FX & intraday trading!
С 25/09/2025
21
Продажи
179
Бесплатные установки