説明
cTraderのネイティブタイムフレームおよび非標準期間(5H、7H、9H、4日、2週間、3ヶ月、年間)をカスタムローソク足として表示し、トグルベースのタイムフレーム切り替えを提供します。
25分足から年間期間まで、任意のチャート上にカスタム期間のローソク足を描画し、期間間の迅速な切り替えのためのタイムフレームトグルボタンを備えています。
包括的な期間オプション(カスタム分/時間/日/週/月)、設定可能なヒゲの太さを持つ視覚的な強気/弱気ローソク足、および迅速なタイムフレーム切り替えのためのトグルコントロールにより、標準チャート間隔の間の期間を必要とするトレーダーに柔軟なマルチタイムフレーム分析を提供します。
機能
包括的な期間オプション
- カスタム分期間:25分、35分、50分、55分
- カスタム時間期間:5H、7H、9H-23H(5時から23時まで毎時)
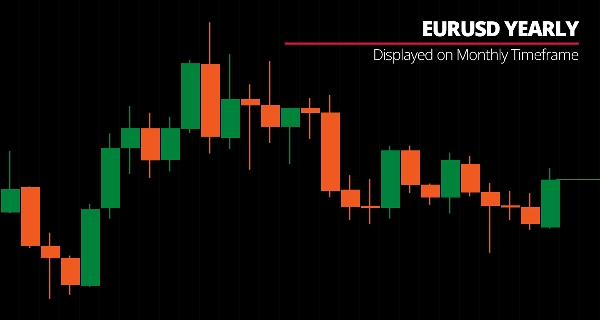
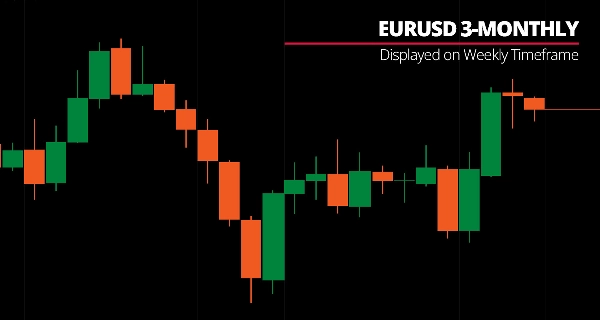
- カスタム日/週/月:4日、2週、3週、2ヶ月、3ヶ月、4ヶ月、6ヶ月、年間
- ネイティブタイムフレーム:すべての標準期間(m1-月間)を強化された視覚化で
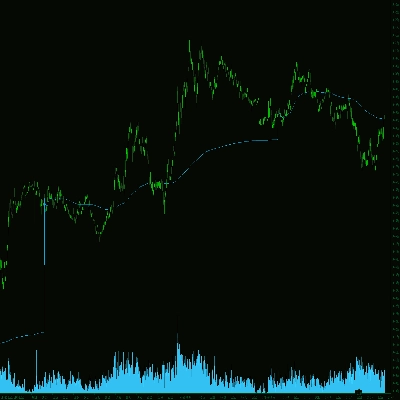
カスタムタイムフレームバー
- 強気/弱気の色分けを持つカスタム期間の視覚的ローソク足
- 設定可能なヒゲの太さ
- クリーンなチャート表示—ネイティブバーを非表示にし、カスタム期間構造のみ表示
- リアルタイム形成追跡
トグルコントロール
- カスタムバー、OHLCライン、MAのオン/オフを素早く切り替えるボタン
- 迅速な機能管理のためのクリーンなインターフェース
- 柔軟な表示設定
__________________________________________________________________________________________
その他の無料インジケーター
構造やボリュームから回帰、ボラティリティ、カスタムタイムフレームまで、幅広い市場分析ツールを探求してください。
ソースコードはGitHub リポジトリで利用可能です。
すべて無料で使用できますが、コーヒーサポートを送りたい場合は こちらからどうぞ。
サポート/レジスタンス
ボリューム
移動平均
- SSLチャネル
- アンカード移動平均
- 偏差スケール移動平均
- ギャンハイローアクティベーター
- 瞬時トレンドライン
- カウフマン適応MAとトレンドビジョン
- 移動平均チャネル
- 移動平均スイート
- トレンドチャネル移動平均
ユーティリティ/カスタム
回帰ベース
ボラティリティ
オシレーター
__________________________________________________________________________________________
免責事項
取引にはリスクが伴います。このインジケーターは技術分析のみを目的としており、常に適切なリスク管理を行い、責任を持って取引してください。
フィードバックと改善
ご提案、機能リクエスト、改善案がありましたら、ディスカッションタブにコメントを残してください。皆様のフィードバックがインジケーターの改善に役立ちます。
概要
カスタマーレビュー
5 | 100 % | |
4 | 0 % | |
3 | 0 % | |
2 | 0 % | |
1 | 0 % |