
説明
究極のcTraderチャートパターンインジケーターでトレーディングを革新しよう
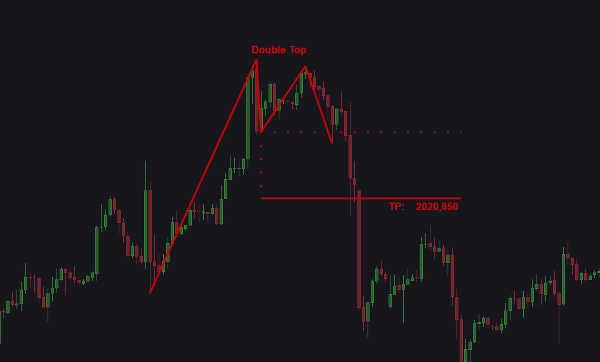
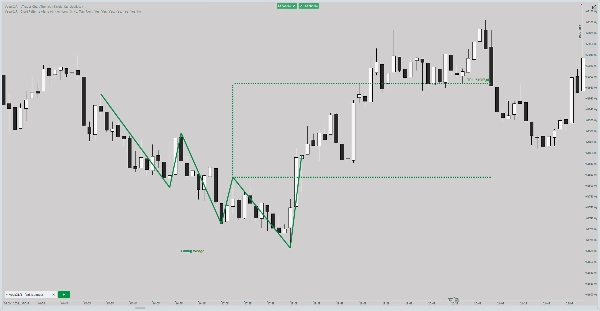
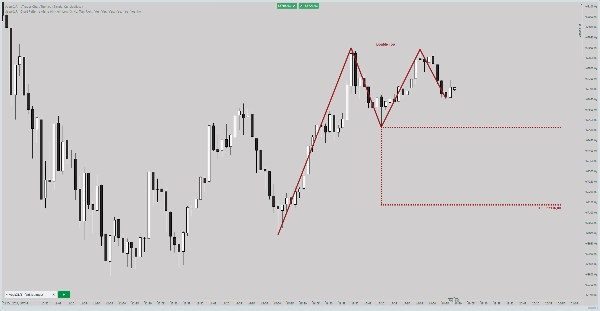
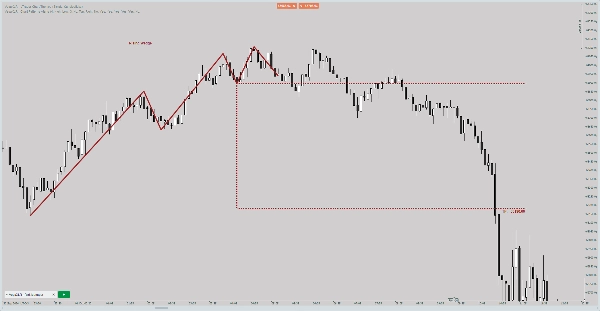
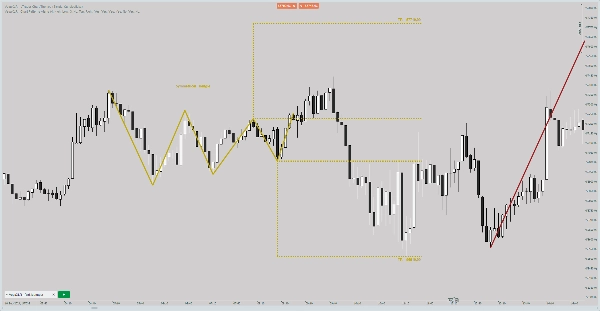
この 最先端のcTraderインジケーターでトレーディング戦略を次のレベルへ引き上げましょう。重要な チャートパターンを検出し強調表示するよう巧みに設計されたこの高度なツールは、正確な市場分析のために、ダブルトップ、ヘッドアンドショルダーズ、上昇三角形などの主要なパターンを特定し、トレーダーに強力な優位性を提供します。これは、外国為替、株式市場取引 およびcTraderプラットフォームに存在するすべての市場に対応しています。
主な特徴:
- 自動チャートパターン検出:ブルフラッグ、対称三角形、および上昇ウェッジなどのパターンを瞬時に検出します。
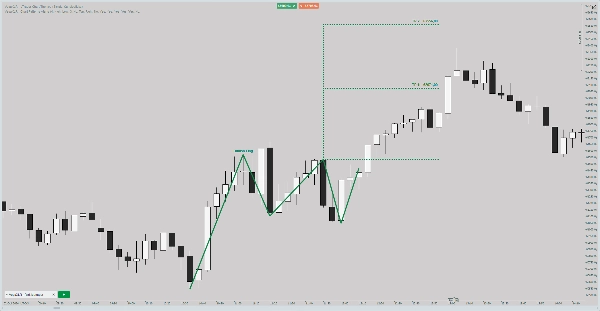
- パターンスイングプロット:ネックライン、ターゲットライン、価格の動きを簡単に視覚化します。
- カスタマイズ可能なアラート:サウンド、ポップアップ、Telegram、またはメールでニーズに合わせた通知を受け取れます。
- 色分けされたインサイト:カスタマイズ可能なカラースキームを使用して、強気、弱気、中立のパターンを素早く区別します。
- 統計付きパターンリスト:略語と出現回数を表示する統合リストでパターンの発生を簡単に追跡します。
- 調整可能なズームレベル:詳細な分析のために特定のパターンサイズに焦点を当てます。
- 利益可能性表示:明確な利益サイズの表示で潜在的な取引機会を評価します。
- タイムフレームとシンボルの明確化:アラートには、情報に基づいた意思決定のためにシンボルとタイムフレームの正確な詳細が含まれます。
- アラート一時停止オプション:通知を一時停止して気を散らさずにパターンを分析できます。
- ユーザーノート機能:戦略の改善やパターン固有のメモのためにコメントを追加できます。
検出されたチャートパターン:
- ダブルトップ
- ダブルボトム
- ヘッドアンドショルダーズ
- 逆ヘッドアンドショルダーズ
- 対称三角形
- 上昇三角形
- 下降三角形
- ブルフラッグ
- ベアフラッグ
- 上昇ウェッジ
- 下降ウェッジ
この 直感的なトレーディングインジケーターは、自動チャートパターン検出、カスタマイズ可能なアラート、およびリアルタイムの視覚化を組み合わせてトレーダーを支援します。外国為替市場での取引、株式チャートの分析、またはcTraderのカスタムインジケーターの探索にかかわらず、このツールはより賢明で自信のある意思決定に必要な洞察を提供します。テクニカル分析を習得し、リスク管理戦略を最適化したいトレーダーに最適です。
この包括的なcTraderインジケーターで、今日からあなたのトレーディングポテンシャルを解き放ちましょう!
警告:
このインジケーターは、チャートパターンと市場データに基づく洞察と視覚化を提供することでトレーダーを支援するために設計されたテクニカル分析ツールです。単独の取引ソリューションとして機能するものではなく、利益を保証するものではありません。ユーザーはこの製品を使用する際に、自身の取引戦略、リスク管理、および意思決定プロセスを実施する必要があります。過去のパフォーマンスは将来の結果を示すものではありません。金融市場での取引は重大なリスクを伴い、失うことができる資本のみで取引すべきです。
概要
Key functionalities include automatic pattern detection, real-time visualization of pattern components like necklines and target lines, and customizable alerts delivered via sound, pop-up, Telegram, or email. It features color-coded insights to distinguish bullish, bearish, and neutral patterns, a pattern list with occurrence statistics, adjustable zoom levels for detailed analysis, and profit potential display to evaluate trade opportunities. Alerts provide clear symbol and timeframe information, and users can pause notifications or add personal notes for strategy refinement.
This tool assists traders in technical analysis and risk management by providing actionable insights based on chart patterns. It is intended as a supportive tool and does not function as a standalone trading solution. Users must apply their own trading strategies and risk controls when using this indicator.
カスタマーレビュー
5 | 67 % | |
4 | 0 % | |
3 | 33 % | |
2 | 0 % | |
1 | 0 % |


![「[Hamster-Coder] Pivot Points MTF」ロゴ](https://cdn.ctrader.com/image/webp/4c143e5a-309c-40e3-a578-f04d1e133ffa_31159)


