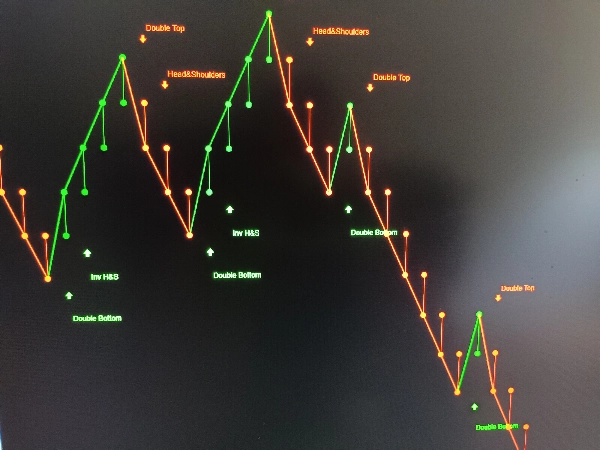
ブローカー&プロップファーム
事業者向け
00
Days
:
00
Hours
:
00
Minutes
:
00
Seconds
Renko Line Chart
「Renko Line Chart」ロゴ
登録日 28/01/2025
販売
5
無料インストール
193
「Renko Line Chart」アップロード画像「Renko Line Chart」アップロード画像「Renko Line Chart」アップロード画像「Renko Line Chart」アップロード画像「Renko Line Chart」アップロード画像


✅ Uses professional formatting with clear hierarchy

✨ Why Traders Love It

"Finally - an indicator that looks as sophisticated as my trading strategy"

0.0
レビュー: 0
カスタマーレビュー
この商品にはまだレビューがありません。お使いになったことがある方は、ぜひレビューをお願いします。
この作成者の他の商品
Renko 4k Pips
Custom your Renko Brick how do you wish!
インジケーター
RSI
ATR
Signal
+1
Trading Fusion Bars 2
This indicator works best as a trend-confirmation tool—wait for multiple signals!
Bars color 1
This is the first version I offer you for free.
Ctreder Smart SMA Indicator
cTreder Smart SMA
インジケーター
Indices
Stocks
Forex
+1
Bullet Chart Trend
Unique Pyramid Design , Clear Price Action Trend
Candelstick xxl
The indicator is designed to detect aggressive movements in the market and without volume for trend changes.
Trend Bars Color
New Trend whit buy-sell signal
Forex Market Color
A single color for each session.
インジケーター
Indices
Stocks
Forex
+1
Bullet Chart
✅ Unique Design. ✅ Works on All Time frames
これも好きかも
Tape reader
TAPE READER :-)
インジケーター
NAS100
NZDUSD
XAUUSD
+11
TradingView ATR
Upgrade to ATR-RMA! Experience the precise ATR using Relative Moving Average for accurate volatility analysis in cTrader
インジケーター
Indices
Breakout
Forex
+2
Time zone pro
FREE Global Trading Sessions Indicator
Moving Average channel
This indicator is designed to display customizable moving averages (MAs) on a chart.
On Balance Volume USD - Combined
See USD demand in one line—Composite OBV fuses six major FX pairs into a clear momentum gauge.
Anchored Moving Average
Anchor a moving average to any point on the chart and watch it extend dynamically as price evolves.
Repiptor RSI Amplified
RSI Amplified
インジケーター
NAS100
NZDUSD
Breakout
+18
Free Smart Money Concepts (SMC) from TradingView
Free Smart Money Concepts from TradingView for cTrader: BOS/CHoCH, OB, FVG, liquidity, MTF levels, discount zones.
Vishal Volume Profile v2.0
Volume Profile plots traded volume at each price level, highlighting high activity zones of precise support & resistance
インジケーター
Forex
Signal
USDJPY
Yen Strength - Line Momentum
Single-line JPY Strength Indicator: Track yen momentum swiftly across key pairs—achieve clarity in your forex trades!
インジケーター
Grid
NAS100
RSI
+19
Delta-RSI Candle Pro
Delta RSI Candle Pro
インジケーター
VWAP
NAS100
XAUUSD
+7
Vwap Manav Indi Button
Automated VWAP bot executes trades at key volume-weighted average price zones with adaptive risk management
[Hamster-Coder] Pivot Points
[Hamster-Coder] Pivot Points (Standard)
Volume Profile Triple Line - POC Median Mode
The Advanced Volume Profile Indicator calculates POC, Median, and Mode, revealing key price levels for smarter trading.
Weekly Daily Levels
The Weekly Daily Levels indicator shows the OHLC, and mid-point prices for the previous day and week.
KDJ
The KDJ oscillator display consists of 3 lines (K, D and J - hence the name of the display) and 2 levels.
インジケーター
NAS100
NZDUSD
Martingale
+26
Dynamic Trend Flux
Dynamic Trend Flux is a colored momentum oscillator based on the classic fast/slow EMA difference plus a signal line.
Fibonacci Prediction Channel
Designed to plot a future prediction channel based on Fibonacci retracement levels 📊