
SwingHighLow
インジケーター
10 購入済
バージョン 1.0、Jul 2025
Windows、Mac
4.3
レビュー: 3
説明
cTrader用スイングハイ/ローインジケーター
プロのようにマーケット構造をマッピング。
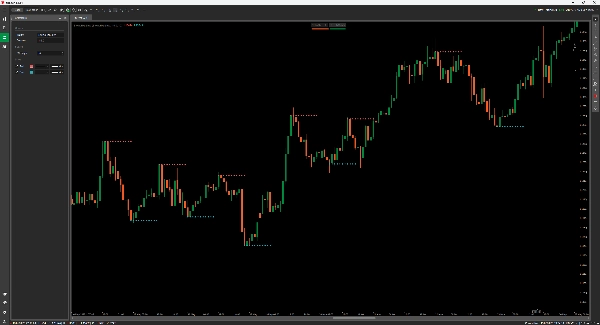
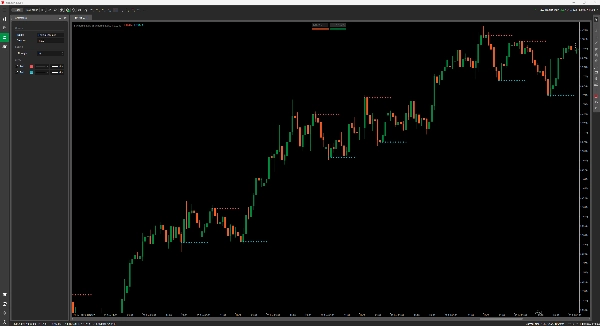
このスイングハイ/ローインジケーターは、チャート上の重要な転換点を自動的に検出してプロットします。価格アクション、構造、サポート/レジスタンスゾーンに依存するトレーダーに最適です。
特徴:
- 確定した スイングハイ(赤)と スイングロー(青)をクリーンなポイントプロットで強調表示します。
- 調整可能な 強度パラメーターでノイズを除去したり、シグナルを厳密にしたりできます。
- トレンド分析、反転の発見、ブレイクアウトトラップに最適です。
すべての時間枠で動作します。再描画なし。しっかりとしたマーケット構造が明確にマークされます。
概要
AIによる概要
The SwingHighLow indicator for cTrader automatically detects and plots significant swing highs and lows on price charts, aiding traders in identifying market structure, price reversals, and support/resistance zones. It highlights confirmed swing highs in red and swing lows in blue with clear point markers. The indicator includes an adjustable strength parameter that allows users to filter market noise or tighten signal sensitivity according to their trading preferences. It is suitable for use across all timeframes and supports analysis for various markets including Forex, indices, commodities, stocks, and cryptocurrencies such as BTCUSD, EURUSD, and XAUUSD. The tool is designed to assist with trend analysis, spotting reversals, and identifying breakout traps without repainting, providing consistent and reliable market structure visualization.
インジケーターのプロフィール
カスタマーレビュー
4.3
レビュー: 3
5 | 67 % | |
4 | 0 % | |
3 | 33 % | |
2 | 0 % | |
1 | 0 % |
カスタマーレビュー
July 22, 2025
Good support for rules for swing point analysis. it helps identify turning points and cleaner structure, especially when used for reviewing reversals, pullbacks and swing zones. Swing points look better after 3 pivots, especially when the 0.5 Fib area agrees with structure. The level is useful when it supports the market story.
July 21, 2025
July 21, 2025
Practical choice for demo for a more controlled workflow. It helps with reviewing reversals, pullbacks and swing zones, but the signal still needs broader context. Swing points look better after 3 pivots, especially when the 0.5 Fib area agrees with structure. I would still keep manual review in the process.
ディスカッション
よくあるご質問
BTCUSD
Forex
Signal
Breakout
Indices
EURUSD
Supertrend
Commodities
Stocks
XAUUSD
ATR
cTrader Storeで入手可能な取引ボット、インジケーター、プラグインなどの商品は、第三者の開発者が提供するものであり、情報と技術の取得のみを目的としてご利用いただけます。cTrader Storeはブローカーではなく、投資助言や個人的な推奨を行うことも、将来のパフォーマンスを保証することもありません。


価格
登録日 03/01/2025
638.03K
取引数量
21.34K
獲得pips
15
販売