
説明
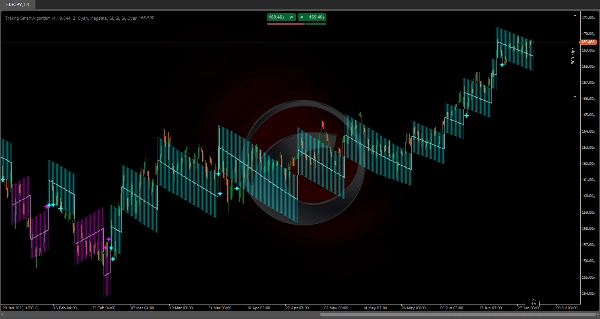
トレーリングスマートアルゴリズム
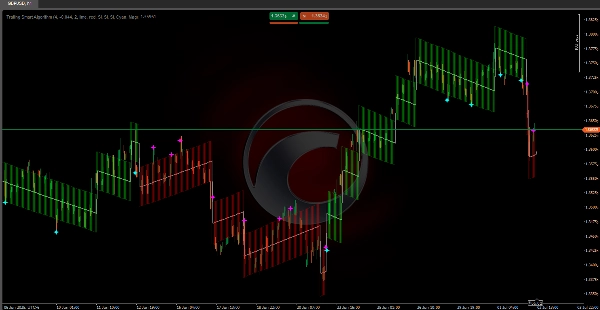
https://chartshots.spotware.com/c/69f0f1d89000b
特に設計された数学的アルゴリズム 🧠 を組み込み、あらゆる市場状況 🌐 で一貫して価格を追跡します。
その計算構造は、トレンドラインが常に価格変動と同期することを保証し、従来の指標の典型的な遅れを回避します ⏳。
従来のアルゴリズムとは異なり、このシステムは正確なボラティリティ測定 📊 を使用し、自動調整 ⚙️ を適用して最適な追跡を保証します。内部計算は、市場の方向性を正確に表現し、急激な動き ⚡ と緩やかなトレンドの発展 🕊️ の両方で精度を維持します。
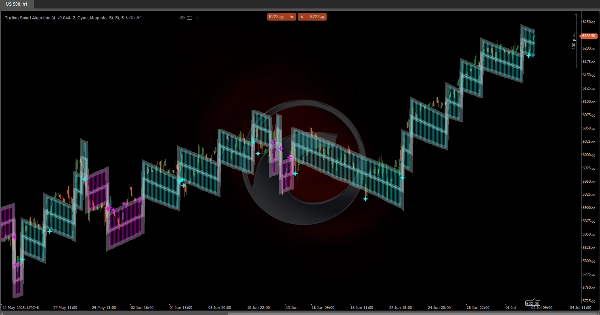
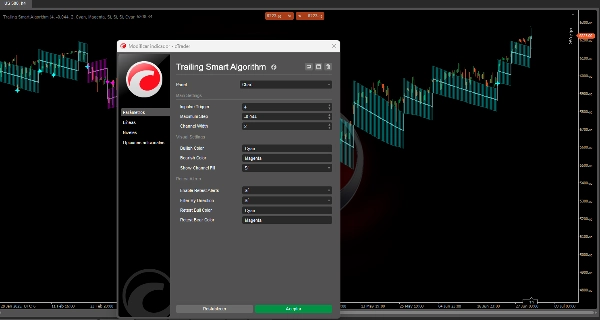
https://chartshots.spotware.com/c/69f0f218591b0
💡 どのように機能しますか?
このインジケーターは、適応ステップシステムを使用して、支配的なトレンドの方向に動きます。
それは、3つの主要な要素に基づいています:
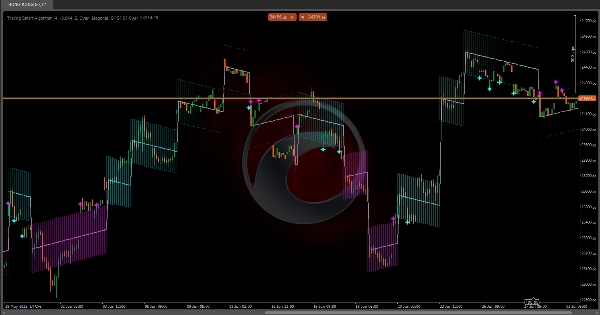
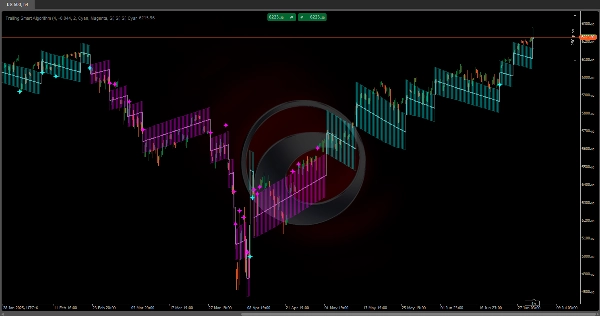
https://chartshots.spotware.com/c/69f0f2b19e4d3
1️⃣ トレンド変化検出
システムは価格を継続的に監視し、特定の閾値を超える重要な動きを検出します(インパルストリガー 🎯)。
価格が現在のトレンドラインから十分に離れると、インジケーターは潜在的な方向転換を認識し、メインラインを再配置します。
2️⃣ 動的トレーリング
方向が設定されると、トレンドラインは一歩ずつ 🪜 市場と同じ方向に動きます。
各ステップは現在のボラティリティ(ATR 📈)に基づいて計算されます:
• よりボラティリティの高い市場では、ステップは大きくなります 🌊
• より静かな市場では、ステップは小さくなります 🌿
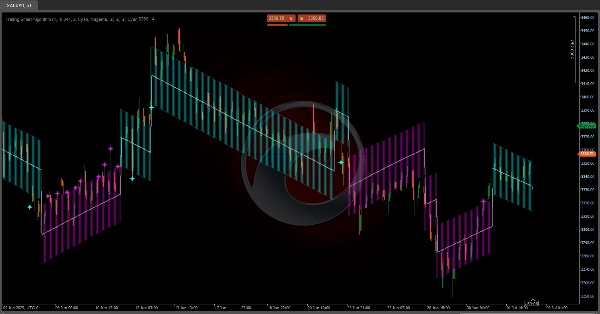
3️⃣ ボラティリティチャネル
メインラインの周りにチャネル(上限バンドと下限バンド)が形成され、通常のボラティリティゾーン 📉📈 を表します。
このチャネルは、価格が通常の範囲内で動いているか、極端な動き 🚨 をしているかを識別するのに役立ちます。
📏 ボラティリティチャネル
• 上限バンド: ボラティリティチャネルの上限
• 下限バンド: ボラティリティチャネルの下限
✨ 再テストシグナル
• シアンの星 🌟: 上昇トレンド中に価格が下限バンドに触れるか越える
• マゼンタの星 ⭐: 下降トレンド中に価格が上限バンドに触れるか越える
⚙️ パラメーター設定
🔹 メインパラメーター
インパルストリガー(デフォルト値:4)
何をするのか?
トレンド変化を検出する感度を決定します。これは、方向転換を引き起こすために価格がどれだけ動く必要があるかを定義するATRの乗数です。
変更時の影響:
• 高い値(5–8):
- トレンド変化に対してより耐性がある 🛡️
- 誤ったシグナルが少ない
- 実際の変化への反応が遅い
• 低い値(2–3):
- 感度が高い 🎯
- 反応が速い
- 横ばい市場で誤ったシグナルを出す可能性が高い
最大ステップ(デフォルト値:-0.044)
何をするのか?
トレンドラインが取ることができる各ステップの最大サイズを制限します。これはキャップとして機能する負の値です。
変更時の影響:
• 負の値が小さい場合(-0.020 から -0.030):
- ステップが大きくなる 🚀
- より積極的なトレンド追跡
• 負の値が大きい場合(-0.050 から -0.080):
- より小さく、緩やかなステップ 🌱
- より保守的な追従
チャネル幅(デフォルト値:2)
何をするのか?
メインラインの周りのボラティリティチャネルの幅を定義します。
変更時の影響:
• 高い値(3–4):
- チャネルが広くなる 🟢
- 再テストシグナルが少なくなる
- ボラティリティに対する許容度が高くなる
• 低い値(1–1.5):
- チャネルが狭くなる 🔴
- 再テストシグナルが増える
- ノイズに対する感度が高くなる
🎨 ビジュアルパラメーター
強気色 / 弱気色
それぞれの上昇トレンドと下降トレンドの色を定義します。
チャネル塗りつぶし表示
ボラティリティチャネルの視覚的な塗りつぶし 🌈 を有効または無効にします。
🔔 再テスト設定
再テストアラートを有効にする
価格がチャネルバンドに触れたときの再テストシグナルを切り替えます。
方向でフィルター
有効にすると、現在のトレンドに一致する再テストシグナルのみを表示します:
• 上昇トレンドの場合:下限バンドのシグナルのみ
• 下降トレンドの場合:上限バンドのシグナルのみ
🌟 再テストシグナルまとめ
• 下限バンドのシアンの星: 動的サポートからの潜在的な強気の反発 ✅
• 上限バンドのマゼンタの星: 動的レジスタンスからの潜在的な弱気の反発 ❌
概要
カスタマーレビュー
5 | 100 % | |
4 | 0 % | |
3 | 0 % | |
2 | 0 % | |
1 | 0 % |


