
説明
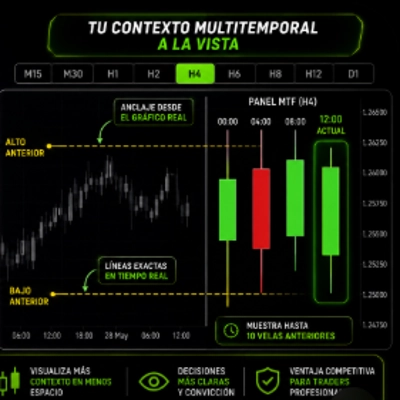
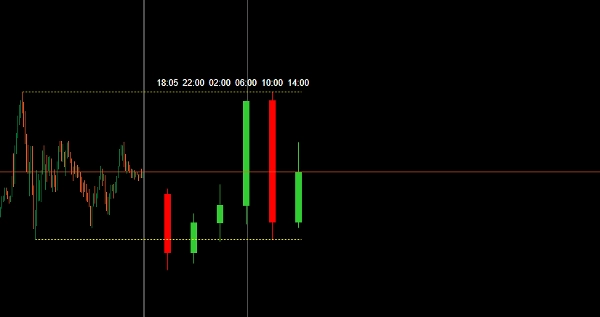
NY HTFキャンドルは、機関投資家、スマートマネーコンセプト(SMC)オペレーター、およびキャンドルレンジ理論(CRT)実践者向けに特別に設計された精密パネルであり、ニューヨークセッションと完全に整合した真のマクロ市場構造を確認する必要がある方に最適です。
真のEST(ニューヨーク)整合の力 機関取引においては、4時間足および日足のキャンドルは、別の大陸にあるランダムなブローカーサーバーではなく、真の市場セッションに合わせる必要があります。カスタムのOffsetHoursパラメータにより、ブローカーの時間をバイパスして直接米国東部標準時(EST)に同期することが可能です。
これにより、NY HTFキャンドルはキャンドルレンジ理論(CRT)の究極のツールとなり、重要な4時間米国キャンドルサイクルを完璧に視覚化できます。
主な特徴と設定
- 対応タイムフレーム: M15からD1まで(H2、H3、H4、H6、H8を含む)。
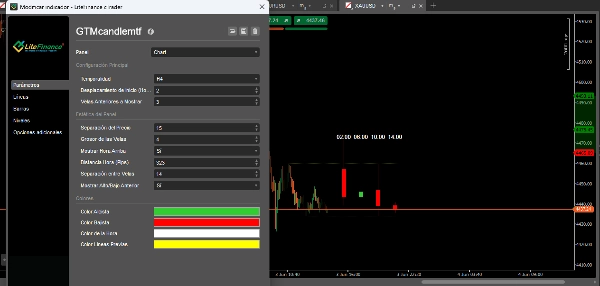
- カスタム履歴管理: パネルに表示する過去のHTFキャンドルの数を正確に制御します。
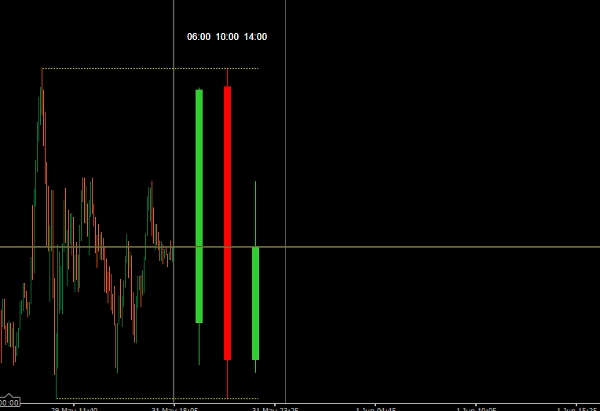
- 自動整列ラベル: 時間ラベルはパネルの最上部に動的に投影され、ヒゲとの重なりを防ぎます。
- 完全な美的コントロール: キャンドルの幅、間隔、現在価格からのパネル距離、およびすべての色を変更して、機関投資家向けのチャートテンプレートに完璧に合わせることができます。
概要
AIによる概要
NY HTF Candles is a specialized indicator panel designed for institutional traders, Smart Money Concepts (SMC) operators, and Candle Range Theory (CRT) practitioners. It provides precise visualization of higher timeframe (HTF) market structure aligned specifically with the New York session, using a custom OffsetHours parameter to synchronize candle times to US Eastern Standard Time (EST) rather than broker server time. This alignment supports accurate analysis of 4-hour and daily candle cycles critical to institutional trading strategies.
Key features include support for multiple timeframes from 15 minutes up to daily, including intermediate intervals such as 2H, 3H, 4H, 6H, and 8H. Users can control the number of historical HTF candles displayed, ensuring tailored chart views. The panel dynamically projects time labels above the highest candle points to avoid overlap with wicks, enhancing readability. Full aesthetic customization is available, allowing modification of candle width, spacing, panel distance from current price, and color schemes to integrate seamlessly with institutional chart templates.
This tool is intended to facilitate precise market structure analysis and candle cycle visualization aligned with the New York trading session for professional trading applications.
Key features include support for multiple timeframes from 15 minutes up to daily, including intermediate intervals such as 2H, 3H, 4H, 6H, and 8H. Users can control the number of historical HTF candles displayed, ensuring tailored chart views. The panel dynamically projects time labels above the highest candle points to avoid overlap with wicks, enhancing readability. Full aesthetic customization is available, allowing modification of candle width, spacing, panel distance from current price, and color schemes to integrate seamlessly with institutional chart templates.
This tool is intended to facilitate precise market structure analysis and candle cycle visualization aligned with the New York trading session for professional trading applications.
インジケーターのプロフィール
ディスカッション
カスタマーレビュー
0.0
レビュー: 0
カスタマーレビュー
この商品にはまだレビューがありません。お使いになったことがある方は、ぜひレビューをお願いします。
よくあるご質問
MSS
Market Structure
cTrader Storeで入手可能な取引ボット、インジケーター、プラグインなどの商品は、第三者の開発者が提供するものであり、情報と技術の取得のみを目的としてご利用いただけます。cTrader Storeはブローカーではなく、投資助言や個人的な推奨を行うことも、将来のパフォーマンスを保証することもありません。




























価格
32
販売
699
無料インストール