
説明
インデックスハンター:概要
インデックスハンターは、主に高ボラティリティの指数、例えば US30(ダウジョーンズ) や NAS100(ナスダック)向けに設計された専門的なテクニカル指標および意思決定支援システムです。過去のデータのみを表示する標準的な指標とは異なり、インデックスハンターは 「ベクトル予測」に焦点を当てています。これは、複数の時間軸にわたる現在の速度(傾き)に基づいて、4本のローソク足先の価格がどこにある可能性が高いかを予測しようとするものです。
1. コアメカニズム(動作原理)
A. 「ベクトル」予測エンジン
これはツールの心臓部です。現在の価格だけを見るのではなく、M5、M15、H1の時間軸にわたる 変化率(傾き)を計算し、チャート上に「未来の軌跡」を描きます。
- メカニズム: 異なる時間軸からのモメンタムの加重平均を計算し、将来の4点(P1、P2、P3、P4)を予測します。
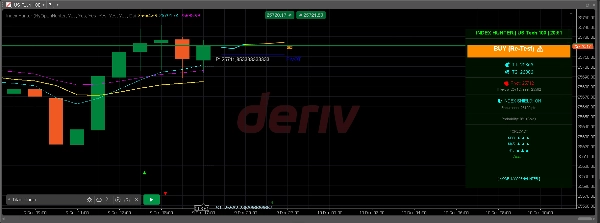
- ビジュアル: 価格の右側に色付きの軌跡(シアン -> イエロー -> オレンジ)が表示され、市場の慣性を視覚化します。
- ゴーストパス: また、前回の予測(ゴーストパス)を記憶し、市場がアルゴリズムの過去の予測を尊重しているかどうか(「現実確認」)を確認できます。
B. マルチレイヤービジュアルシステム
重要な機関レベルを自動的にオーバーレイします:
- ピボットポイント(柔軟): 選択可能な時間軸(H12、日次、Day2、Day3)に基づいてピボット、R1/S1、R2/S2レベルを自動計算します。
- 心理的レベル: 100ポイントごと(例:34000、34100)に「サイコライン」を描画し、これらは指数にとって磁石のようなゾーンとして機能することが多いです。
- 日次高値/安値: 前日のレンジをマークし、ブレイクアウトや拒否ゾーンを示します。
- フラクタル: 局所的な高値と安値を矢印(▲ ▼)で特定し、正確なエントリーやストップロスの配置を支援します。
C. 「信頼度」&実現可能性ロジック
ツールは単にシグナルを出すだけでなく、その評価も行います。
- 計算: 利益目標までの距離を測定し、市場の現在のエネルギー(ATR - 平均真の範囲)と比較します。
- 出力:
-
- HOT(>80%): 強いモメンタム+合理的な目標距離。
- WARM(50-80%): 中程度のセットアップ。
- COLD(<50%): 市場は目標達成の可能性が低いと見なしています(例:現在のボラティリティに対して目標が遠すぎる)。
D. アカウント「シールド」メカニズム
パネルにはパッシブなリスクマネージャーが含まれています:
- 耐久指標: 残高と最小ロットサイズに基づき、市場がどれだけの「ポイント」を逆方向に動かせるかを計算し、アカウントの危険度を示します。
- ステータス: アカウントが現在のボラティリティ(ATR)に対して安全な場合は「🛡️ INDEX SHIELD: ON」、ボラティリティが残高に対して高すぎる場合は「⚠️ LOW MARGIN」と表示されます。
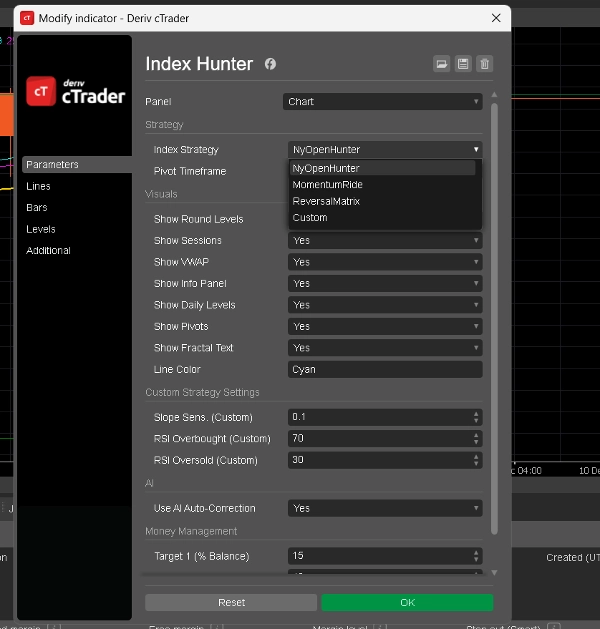
2. 利用可能なモード(戦略)
インジケーター設定でこれらのモードを切り替えることができます(
Index Strategy
パラメーター)。各モードはAIの市場解釈を変えます。
1. モード:NyOpenHunter(ニューヨークスキャルパー)
- 最適な用途: 米国市場オープンの混沌とした最初の2〜3時間。
- ロジック:
-
- 稼働時間: 13:00 - 17:00 UTC(概算)。
- トリガー: M5傾きが 0.1より大きい(または-0.1未満)場合を探します。
- 哲学: 「爆発を捉える」。NYベルでの最初のボリュームの急増を待ち、その特定の波に乗るシグナルを出します。
- パネルセンチメント: 「NY OPEN BUY 🚀」または「NY OPEN SELL 🔻」を表示します。
2. モード:MomentumRide(トレンドフォロワー)
- 最適な用途: オープン時間外の強く持続的なトレンド。
- ロジック:
-
- トリガー: NYモードよりも 強いM5傾き(> 0.2)が必要です。
- 哲学: 「切り刻まれない」。弱い動きを無視し、市場が強い確信を持って動いているときのみシグナルを出します。
- パネルセンチメント: 「MOMENTUM UP 🟢」または「MOMENTUM DOWN 🔴」を表示します。
3. モード:ReversalMatrix(カウンタートレンド)
- 最適な用途: レンジ相場やトップ/ボトムの捕捉。
- ロジック:
-
- トリガー: RSI(相対力指数)を使用します。
-
- 売りシグナル: RSI > 75(買われ過ぎ)。
- 買いシグナル: RSI < 25(売られ過ぎ)。
- 哲学: 「極端をフェードする」。ゴムバンドが過度に伸びており、反発する可能性が高いと識別します。
- パネルセンチメント: 「OVERBOUGHT(まもなく売り)」または「OVERSOLD(まもなく買い)」を表示します。
4. モード:カスタム(ユーザー定義)
- 最適な用途: ボットの調整を行いたい上級ユーザー向け。
- ロジック: 設定で 傾き感度 および RSIレベル の閾値を自分で設定できます。
-
- 例: 傾き > 0.05 かつ RSI < 40 の場合のみ買うハイブリッド戦略を作成できます。
3. 「情報パネル」(ヘッズアップディスプレイ)
チャート右側のビジュアルパネルはこれらすべてのデータを統合しています:
- ヘッダー: 現在のモードとシンボルを表示します。
- プリファレンス: 主なAIのバイアス(例:「BUY 34150 ▲」)。
- ターゲット(T1、T2): アカウントのパーセンテージ設定とボラティリティに基づいて計算された動的な利益目標。
- 予測: M30、M45、H1のトレンドの連続分析(例:「M30: ▲ ▲ ▲」は強い買いの整合を意味します)。
- 確率: AIの信頼度スコア(ホット/ウォーム/コールド)。
概要
Key features include an automatic overlay of institutional levels such as pivot points (with selectable timeframes), psychological price levels at 100-point intervals, previous day’s high/low, and fractals marking local tops and bottoms. It incorporates a confidence grading system (Hot, Warm, Cold) based on momentum strength and volatility relative to profit target distance.
Index Hunter includes a risk management "Shield" that assesses account safety by calculating potential adverse market moves against account balance and lot size, displaying status alerts accordingly.
The indicator offers four operational modes: NyOpenHunter (New York market open scalping), MomentumRide (trend following), ReversalMatrix (counter-trend using RSI), and a Custom mode for user-defined slope and RSI thresholds. A comprehensive info panel consolidates mode, bias, dynamic targets, trend forecasts, and confidence scores for decision support.
カスタマーレビュー
5 | 67 % | |
4 | 33 % | |
3 | 0 % | |
2 | 0 % | |
1 | 0 % |


![「[Hamster-Coder] Pivot Points MTF」ロゴ](https://cdn.ctrader.com/image/webp/4c143e5a-309c-40e3-a578-f04d1e133ffa_31159)


