
Descrição
Previsão de Preços Baseada em MACD
Visão Geral
Este indicador ultrapassa as limitações do MACD tradicional ao ir além da análise histórica, introduzindo de forma inovadora memória histórica e algoritmos estatísticos para prever a ação futura dos preços.
Mecânica Principal:
- Memória de Tendência Histórica: O indicador registra o deslocamento de preço das tendências MACD passadas (tanto de alta quanto de baixa) em relação aos seus pontos de partida, construindo um banco de dados estatístico de até 50 tendências recentes.
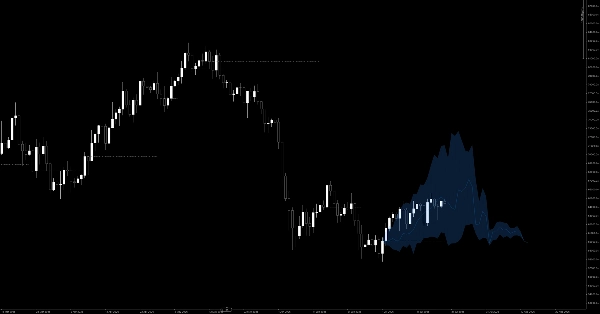
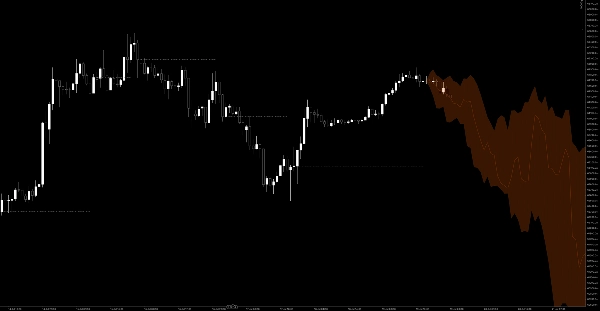
- Leque de Previsão de Probabilidade: Quando ocorre um novo cruzamento do MACD (seja cruzando a linha zero ou a linha de sinal), o indicador recupera dados da memória histórica. Ele calcula os percentis de 20%, 50% e 80% das variações de preço e projeta um leque de previsão de probabilidade para os próximos 100 candles no lado direito do gráfico.
- Nuvem Dinâmica da Área de Sinal: Marca o "Preço de Referência" onde a reversão da tendência se originou. Quando o preço em tempo real está acima deste preço de referência em uma tendência de alta, pinta uma área de nuvem verde; inversamente, pinta uma nuvem vermelha em uma tendência de baixa. Isso fornece uma confirmação visual imediata do momentum real de alta ou baixa.
(Nota: Este indicador apresenta renderização gráfica altamente otimizada, utilizando mistura contínua de polígonos para zonas visuais claras e uma linha de referência descontínua refinada para uma experiência de gráfico incrivelmente limpa.)
Regras de Negociação & Guia do Usuário
Este indicador vai além dos simples sinais de "comprar/vender no cruzamento"—ele fornece a você um roteiro probabilístico para suas negociações.
1. Encontrando Entradas (Confirmação de Tendência)
- Entradas Longas: Quando ocorre um cruzamento de alta do MACD, um leque de previsão azul projetando para cima aparecerá à direita. Não entre às cegas. Espere para ver se o preço se estabiliza acima da linha tracejada-pontilhada (Preço de Referência) e uma nuvem verde de alta começa a se expandir. Isso confirma que o momentum atual corresponde às estatísticas históricas de alta, proporcionando uma oportunidade sólida para comprar na baixa.
- Entradas Curtas: Quando ocorre um cruzamento de baixa do MACD, um leque de previsão laranja projetando para baixo aparecerá. Procure o preço permanecer abaixo da linha de referência com uma nuvem vermelha de baixa em expansão para confirmar uma entrada curta em um pullback.
2. Definindo Alvos de Take Profit
O leque de previsão atua como um excelente guia dinâmico de take profit:
- Alvo 1 (A Linha do Meio): A linha do meio dentro do leque representa o percentil histórico de 50% (a trajetória média). Quando o preço toca essa linha, significa que o movimento atual alcançou a média histórica, tornando-se um ponto ideal para realizar lucros parciais.
- Alvo 2 (As Bordas Externas do Leque): O limite superior (percentil de 80%) ou o limite inferior (percentil de 20%) representa extremos históricos. Se o preço atingir essas bordas, o momentum está fortemente esgotado, e uma reversão ou recuo profundo é altamente provável. Considere fechar toda a posição.
3. Colocação Científica do Stop Loss
- A linha cinza tracejada (Preço de Referência) atua como a linha base para toda tendência.
- Ao entrar comprado, posicione seu stop loss ligeiramente abaixo dessa linha cinza. Se o preço romper o preço de referência e a nuvem verde desaparecer, significa que a ação real do preço invalidou a probabilidade histórica de alta. A configuração da tendência falhou, e você deve cortar suas perdas imediatamente.
4. Filtro para Mercado em Consolidação
- Se ocorrer um cruzamento do MACD mas o leque de previsão projetado parecer muito plano ou contraído, isso significa que historicamente, cruzamentos similares resultaram apenas em movimentos laterais e irregulares.
- Quando você vir um leque plano, fique parado e evite negociar. Espere pelo próximo ciclo onde o leque mostre expansão clara para cima ou para baixo.
Resumo
Key features include a probability forecasting fan that projects 20%, 50%, and 80% price change percentiles for the next 100 bars following a MACD crossover. The indicator visually displays this fan on the chart, with blue fans for bullish signals and orange for bearish. A dynamic signal area cloud highlights momentum: green for confirmed uptrends above a reference price and red for downtrends below it.
Trading guidance involves waiting for price confirmation above or below the reference price and cloud before entering long or short positions. The forecasting fan also serves as a dynamic take-profit guide, with the middle line representing average historical moves and outer edges indicating potential trend exhaustion. Stop-loss placement is recommended just beyond the reference price line to manage risk.
Additionally, the indicator filters ranging markets by identifying flat or contracted fans, signaling sideways price action and advising traders to avoid entering trades during such periods. The indicator supports visualization outputs and is tagged under MACD and momentum indicators.
















![Logótipo de "Wyckoff Toolkit [Iridio Capital]"](https://cdn.ctrader.com/image/webp/5318c788-91ef-4297-bca6-4ce73b1516a8_61556)